


 394 476

persistence were statistically significantly greater with
mirabegron than with tolterodine ER in all patients, as well
as in all three predefined subcohorts (
p
<
0.0001 all compar-
isons;
Supplementary Table 3
). Mean MPR was significantly
higher with mirabegron than with tolterodine ER in all
patients (0.60 vs 0.55;
p
= 0.03), and in the treatment-naı¨ve
subcohort (0.59 vs 0.49;
p
= 0.004;
Supplementary Table 3
).
3.1.3.
Sensitivity analysis
Sensitivity analyses around the MAGD yielded findings
similar to the base-case analysis (
Supplementary Table 4
).
3.2.
Mirabegron versus other antimuscarinics
3.2.1.
Unmatched analysis
Persistence was statistically significantly better with
mirabegron than with each of the other antimuscarinics
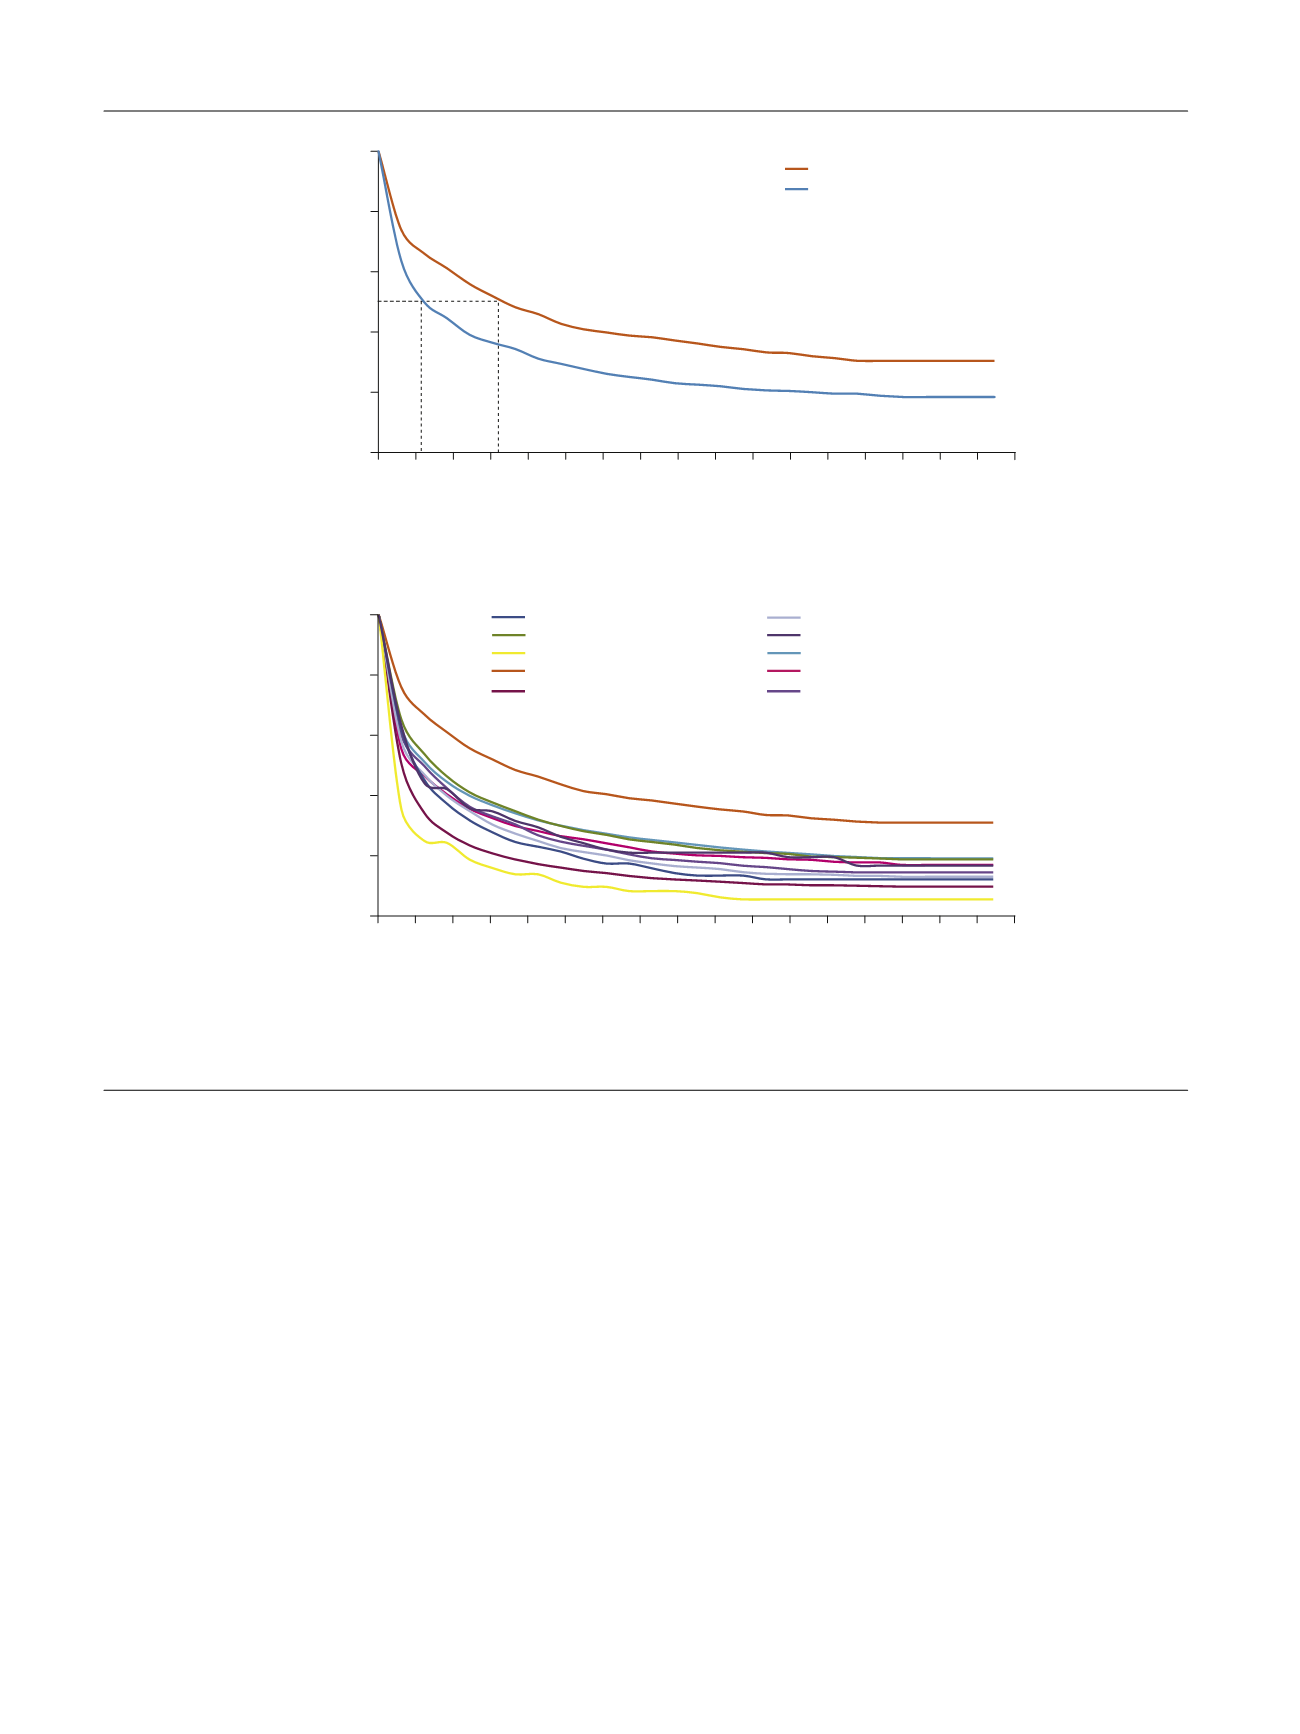
( Table 4). The median time to discontinuation was
significantly longer with mirabegron (169 d) than with
other antimuscarinics (range 30–78 d), with the adjusted
HR ranging from 1.24 to 2.26 (
p
<
0.0001 all comparisons;
Fig. 2 B). Persistence at 12 mo was also significantly
greater with mirabegron (38%) than with other anti-
muscarinics (range 8.3–25%;
p
<
0.0001 for all agents,
except
p =
0.002 for oxybutynin IR). Mirabegron statisti-
cally significantly increased both persistence endpoints
compared to each of the other antimuscarinics in all
predefined subcohorts, with the exception of propiverine
in treatment-experienced patients (
Supplementary
Tables 5–13
). The mean MPR was statistically significant-
ly greater with mirabegron (0.59) than with other
antimuscarinics in all patients (range 0.41–0.53;
p
values
0.01 to
<
0.0001;
Table 4) and in treatment-naı¨ve patients
(range 0.39–0.51;
p
values 0.02 to
<
0.0001;
Supplemen-
tary Tables 5–13
).
Treatment discontinuation was significantly more likely
in women (
p
= 0.0075), in patients with more comorbidities
(
p
= 0.0006), patients aged
<
65 yr (
p
<
0.0001), treatment-
naive patients (
p
<
0.0001), and patients receiving two or
more other medications
( Table 3).
[(Fig._2)TD$FIG]
Tolterodine IR (
n
= 1523)
Trospium (
n
= 943)
Solifenacin (
n
= 8191)
Oxybutynin IR (
n
= 5779)
Oxybutynin ER (
n
= 1144)
Mirabegron (
n
= 1203)
Fesoterodine (
n
= 1287)
Darifenacin (
n
= 126)
Flavoxate (
n
= 144)
Propiverine (
n
= 95)
0
20
40
60
80
100
0
200 250
100 50
150
300 350 400 450 500 550 600 650 700 750 800 850
Probability of staying on treatment (%)
Treatment duration (d)
Log-rank test:
p
< 0.0001
1203
19232
No. at risk
Mirabegron
Antimuscarinic
drug group
566
5173
515
4653
706
7093
877
10343
624
5942
486
4271
461
3911
416
3437
328
2769
255
2217
188
1752
127
1321
90
941
90
677
90
407
0
407
0
0
0
20
40
60
80
10
(a)
(b)
0
0
200 250
100 50
150
300 350 400 450 500 550 600 650 700 750 800 850
1203
1561
No. at risk
Mirabegron
Tolterodine ER
566
434
515
394
706
607
877
889
624
497
486
357
461
325
416
286
328
247
255
187
188
147
127
113
90
85
90
65
90
65
0
65
0
0
Probability of staying on treatment (%)
Treatment duration (d)
Mirabegron (
n
= 1203)
Tolterodine ER (
n
= 1561)
Log-rank test:
p
< 0.0001
56 d
169 d
Fig. 2 – Time to discontinuation for mirabegron versus (A) tolterodine ER and (B) other antimuscarinics. ER = extended release; IR = immediate release.
E U R O P E A N U R O L O G Y 7 2 ( 2 0 1 7 ) 3 8 9 – 3 9 9
394