


 392 476

were compared between cohorts using Fisher’s exact test or a
x
2
test,
depending on the sample size.
Patients in the mirabegron cohort were randomly matched (1:1) to
patients in each of the other target drug cohorts based on sex, age (
<
65
or 65 yr), Charlson comorbidity index score
[22,23], and treatment
status (naı¨ve or experienced) using a greedy algorithm. All analyses were
repeated in matched populations.
Analyses were performed using SAS version 9.4 (SAS Institute, Cary,
NC, USA).
3.
Results
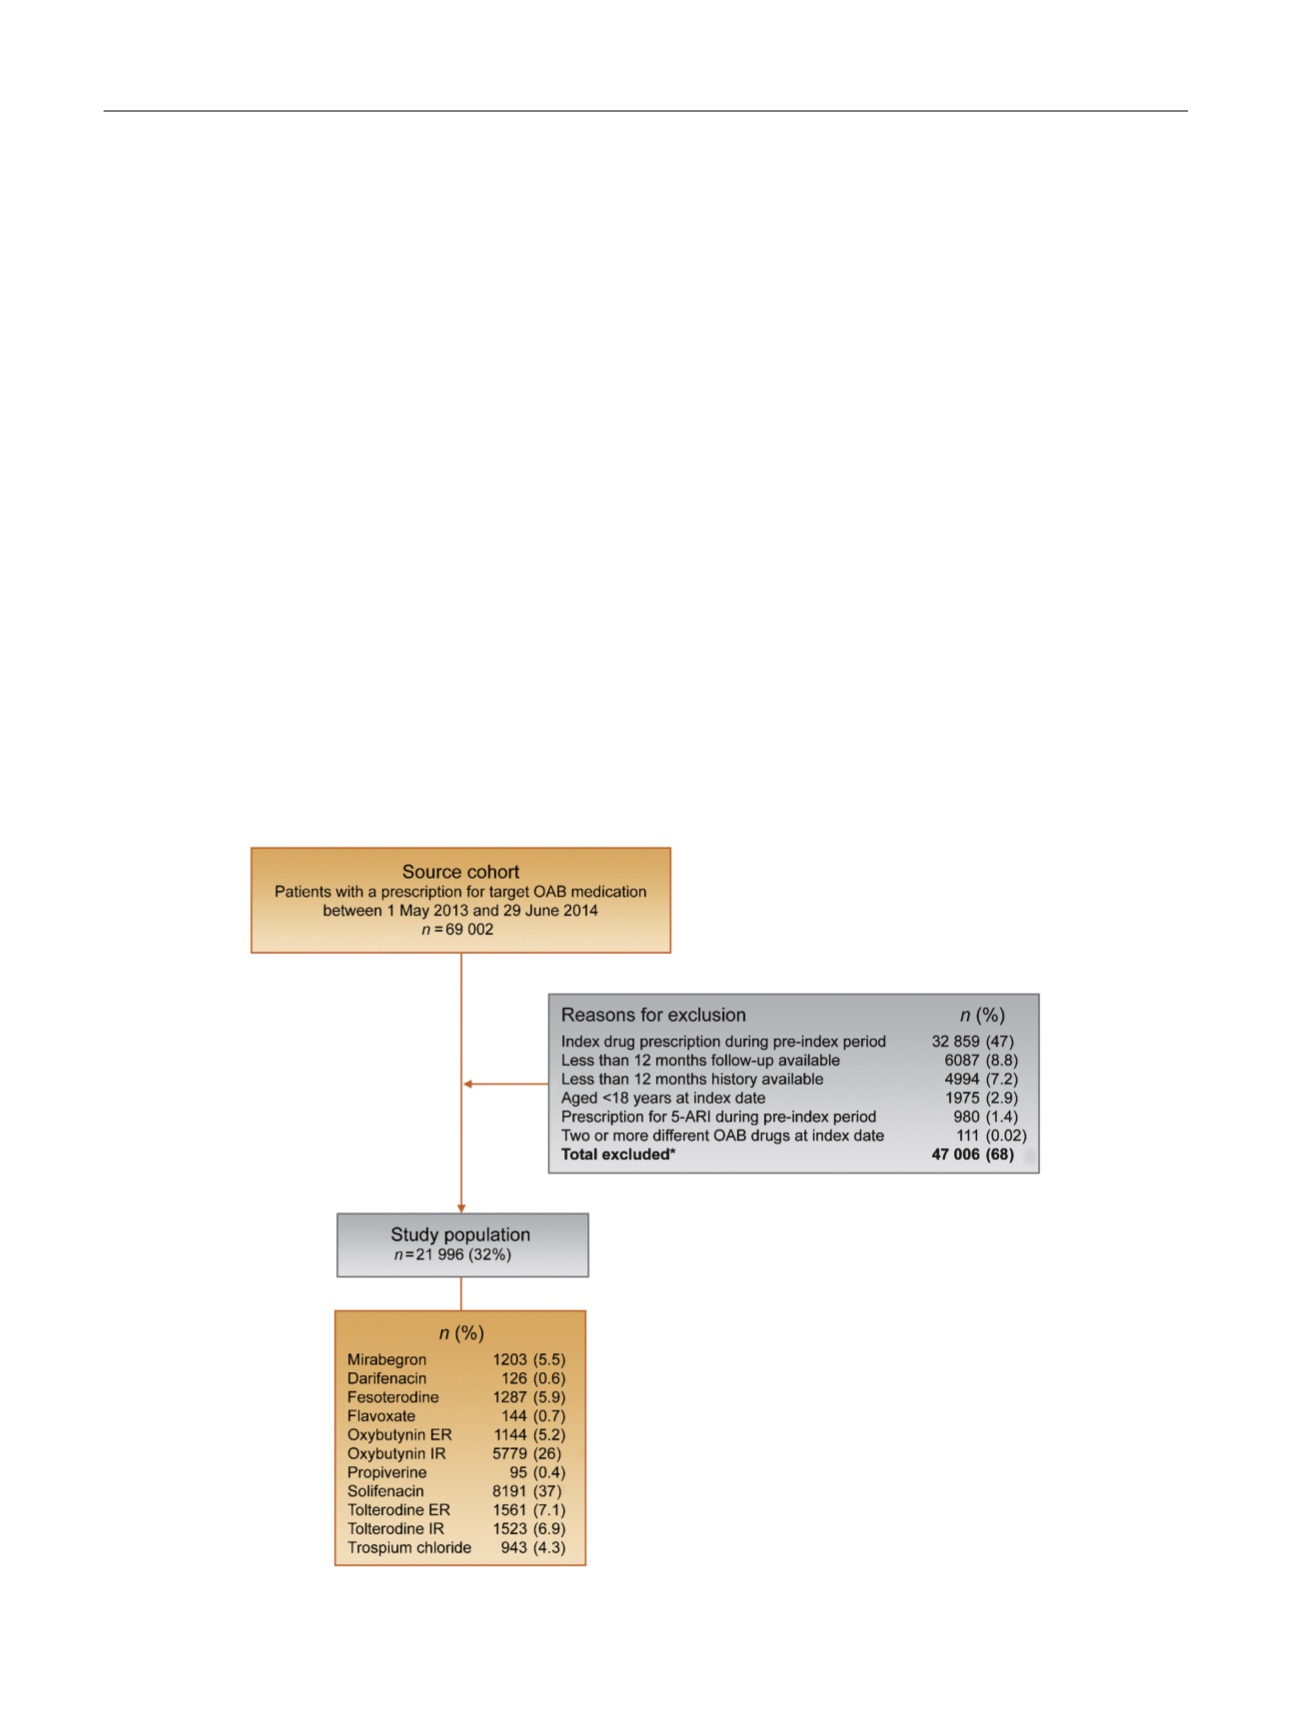
Between May 1, 2013 and June 29, 2014, 69 002 patients
with at least one prescription for a target OAB drug were
identified. A total of 47 006 (68%) patients were excluded
( Fig. 1), so 21 996 (32%) patients constituted the study
population. Solifenacin was the most commonly prescribed
drug (
n
= 8191, 37%), followed by oxybutynin IR (
n
= 5779,
26%). Other target drugs each accounted for less than 10% of
the study population, including mirabegron (5.5%). All
patients were followed for 12 mo.
Patient demographics and characteristics at baseline are
presented in
Table 1 .Compared to tolterodine ER, a
significantly higher proportion of patients prescribed
mirabegron were female (76% vs 64%), treatment-experi-
enced (60% vs 26%), and receiving more than eight
coexisting medications at the index date (25% vs 19%).
3.1.
Mirabegron versus tolterodine ER
3.1.1.
Unmatched analysis
Persistence was statistically significantly greater with
mirabegron than with tolterodine ER
( Table 2). The median
time to discontinuation with mirabegron was 169 d (inter-
quartile range [IQR] 41–not reached) compared to 56 d (IQR,
28–254) with tolterodine ER (adjusted HR 1.55, 95% CI 1.41–
1.71;
p
<
0.0001;
Fig. 2A). Persistence at 12 mo was also
significantly greater for mirabegron (38%) than for tolter-
odine ER (20%; adjusted OR 0.48, 95% CI 0.40–0.58;
p
<
0.0001). Both persistence endpoints were significantly
greater with mirabegron than with tolterodine ER in all
predefined subcohorts (treatment-naı¨ve, treatment-experi-
enced, and 65 yr;
p
<
0.0001 for all comparisons;
Table 2).
Mean MPR was significantly greater with mirabegron than
with tolterodine ER in all patients, and in the treatment-
naı¨ve and 65-yr-old subcohorts (
p
<
0.0001 all compar-
isons;
Table 2).
Treatment discontinuation was significantly more likely
in treatment-naı¨ve patients (
p
<
0.0001), whereas age, sex,
comorbidities, hypertension, and coexistent medications
did not affect persistence
( Table 3).
3.1.2.
Matched analysis
Matched patient baseline characteristics are presented in
Supplementary Table 2
. Time to discontinuation and 12-mo
[(Fig._1)TD$FIG]
Fig. 1 – Patient selection flowchart. 5-ARI = 5
a
reductase inhibitor; ER = extended release; IR = immediate release; OAB = overactive bladder. *Patients
may have had more than one reason for exclusion.
E U R O P E A N U R O L O G Y 7 2 ( 2 0 1 7 ) 3 8 9 – 3 9 9
392