


 463 476

NanoQuant spectrophotometer (Tecan). RNA integrity was assessed
using a 2100 Bioanalyzer (Agilent Technologies) and only samples with
an RNA integrity number (RIN)
[11_TD$DIFF]
5 were included. RNA was extracted
from formalin-fixed paraffin-embedded (FFPE) tissue using an miRNeasy
FFPE Kit (Qiagen) according to the manufacturer’s instructions.
2.3.
cDNA synthesis, PCR amplification, and progression score
calculations
For RNA extracted from fresh-frozen (FF) tumours, cDNA synthesis and
PCR amplification were carried out as previously described
[17]on a
7900HT PCR system (Thermo Fisher Scientific) using 500 ng of RNA as
input material in 384-well plates. For RNA extracted from FFPE tissue,
2
m
g of RNA was reverse-transcribed to cDNA using a high-Capacity
cDNA Archive Kit (Applied Biosystems) according to the manufacturer’s
instructions. The cDNA was diluted 1:5 and 2
m
l was used as template in
a 5-
m
l real-time PCR. Progression scores were computed using non-
normalized cycle threshold (Ct) values based on the formula: mean Ct
(
COL4A3BP
,
MBNL2
,
NEK1
,
FABP4
,
SKAP2
) –mean Ct (
KPNA2
,
BIRC5
,
UBE2C
,
CDC25B
,
COL4A1
,
MSN
,
COL18A1
). The previously described optimal cut-
off (0.79) and 90% sensitivity cut-off ( 0.17) were used in dichotomising
the progression scores
[17] .[(Fig._1)TD$FIG]
KPNA2
BIRC5
UBE2C
CDC25B
MSN
COL4A1
COL18A1
COL4A3BP
NEK1
MBNL2
SKAP2
FABP4
-1 Ct
1 Ct
0
EORTC risk score
Stage
Grade
BCG
CIS
Cystectomy
Progression to MIBC
A
B
862 patients 979 tumours
799 patients 907 tumours
793 patients 897 tumours
<500 ng RNA available
(362 pts, 509 tumours excluded)
RNA quality: RIN <5
(18 pts, 22 tumours excluded)
Carcinoma cell % <10
(6 pts, 10 tumours excluded)
817 patients 929 tumours
Missing clinical information
(45 pts, 50 tumours excluded)
750 patients 851 tumours
MIBC at pathology re-evaluation
(43 pts, 46 tumours excluded)
Cut-off
optimal
Cut-off
90%sens
Molecular high risk
Molecular low risk
High exp.
Low exp.
5
4
3
2
1
0
-1
-2
-3
Progression score
Patients initially enrolled
1224 patients 1488 tumours
RT-qPCR analysis
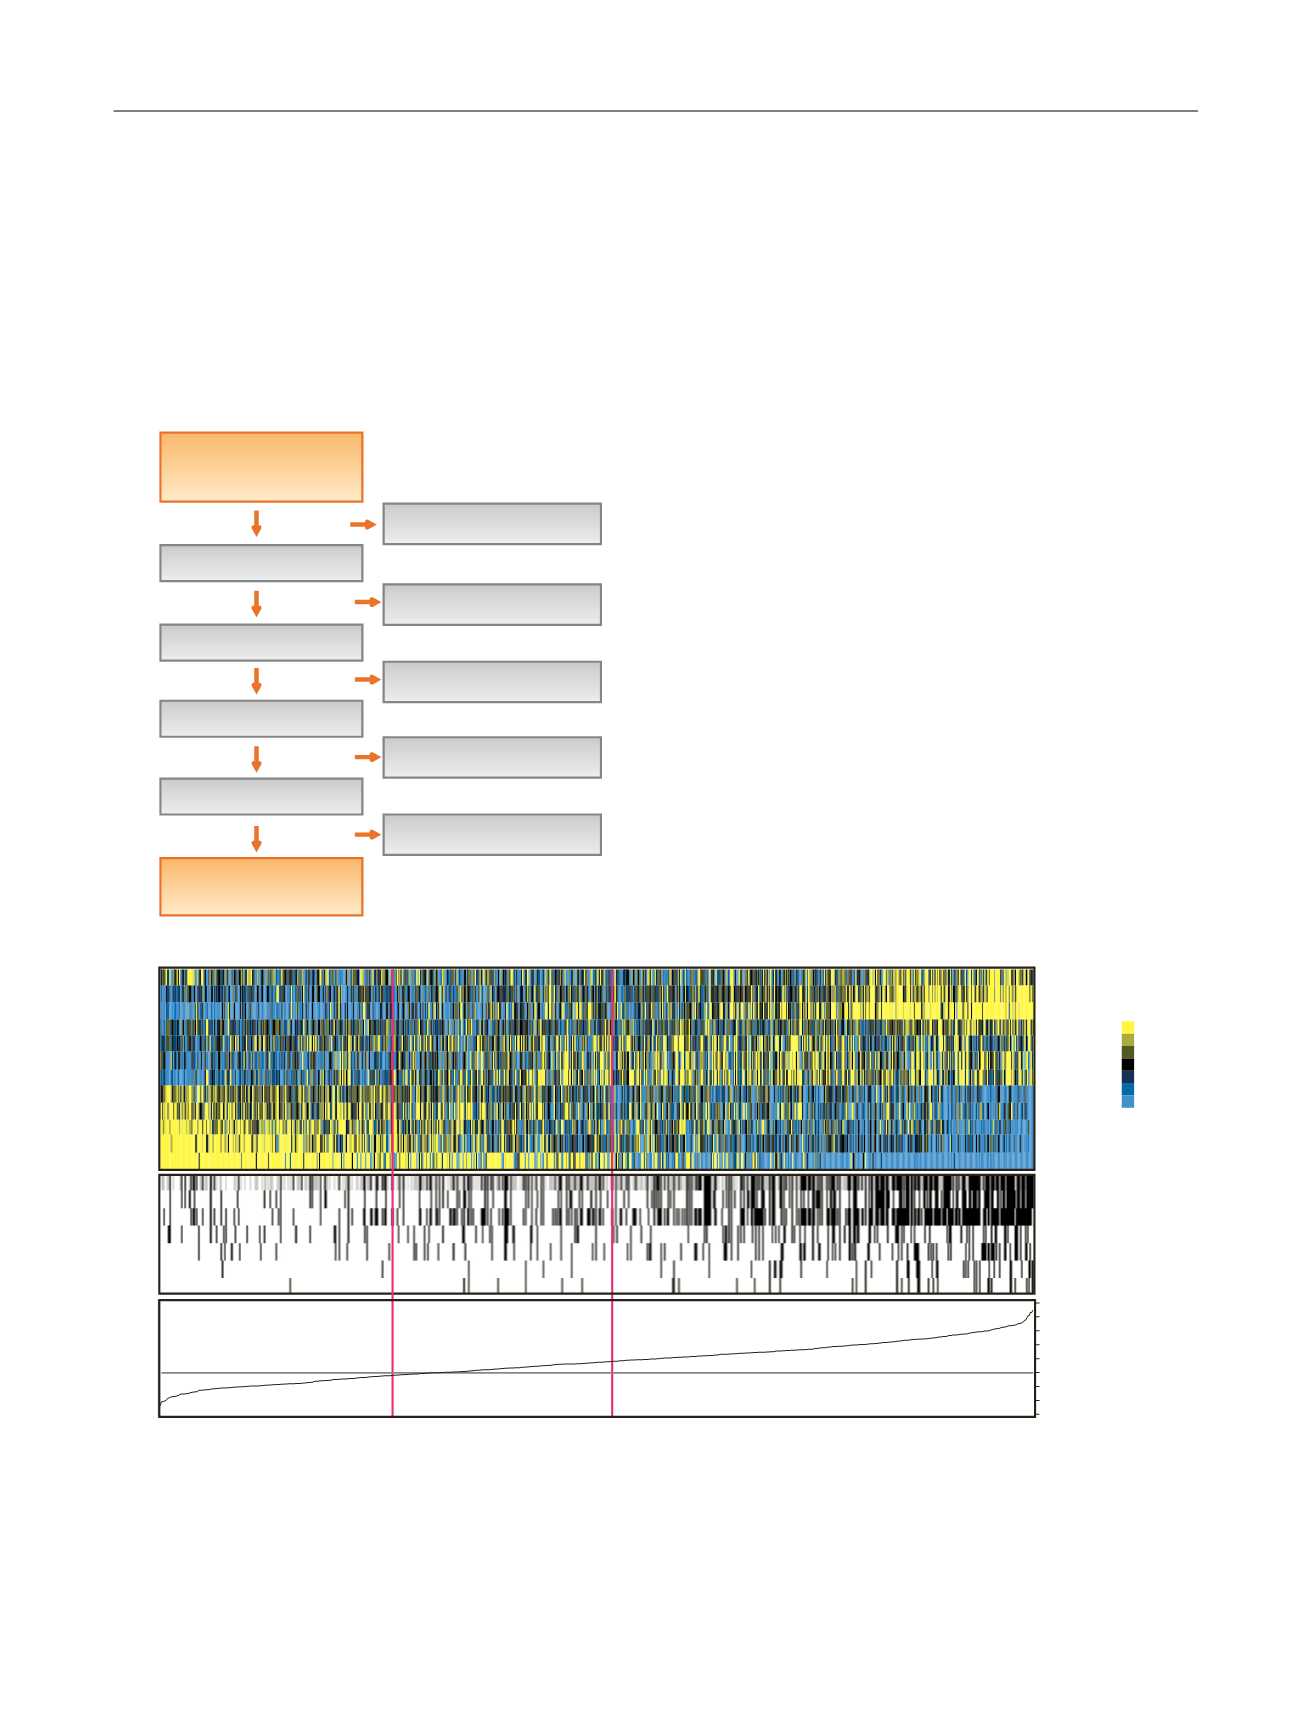
Fig. 1 – Patient enrolment and 12-gene expression assay performance. (A) Flow chart of patient enrolment and exclusion. (B) Heat map of the
expression of the 12 genes included in the assay for the first tumours included from each patient (
n
= 750) together with clinical and histopathological
characteristics. The distribution of the continuous progression score and associated cut-off values are shown in the bottom panel. Samples are sorted
according to the progression score. Colour coding: Stage: Ta, white; T1 + CIS, black. Grade: low grade + PUNLMP, white; high grade, black. BCG
treatment: no, white; yes, black. CIS any time in disease course: no, white; yes, black. Cystectomy: no, white; yes, black. Progression to MIBC: no
(white), yes (black); EORTC risk score: low (white), intermediate (grey), high (black). MIBC = muscle-invasive bladder cancer; CIS = carcinoma in situ;
PUNLMP = papillary urothelial neoplasm of low malignant potential; MIBC = muscle-invasive bladder cancer; EORTC = European Organisation for
Research and Treatment of Cancer; RT-qPCR = real-time qualitative polymerase chain reaction; pts = patients; Ct = cycle threshold.
E U R O P E A N U R O L O G Y 7 2 ( 2 0 1 7 ) 4 6 1 – 4 6 9
463