


 467 476

FGFR3
mutations were found to be associated with greater
recurrence in a large-scale prospective study of NMIBC
[22]. Immunohistochemistry has also been used to docu-
ment the prognostic value of progression markers, includ-
ing
KPNA2
,
BIRC5
, and
UBE2C
, which are part of the 12-gene
progression score, in large independent patient cohorts
[23–25]. Here we performed a prospective independent
validation of the 12-gene progression score for outcome
prediction in patients with NMIBC. We found that the test
provided independent prognostic power over well-estab-
lished clinical and histopathological risk factors. Further-
more, the 12-gene progression score was significantly
associated with previously identified molecular classes
[15].
Patients diagnosed with bladder cancer have a high
recurrence rate, often with multifocal tumour occurrence,
and tumours are thought to develop via field cancerisation
of the bladder
[26]. This is supported by the observation
that recurrent tumours share multiple clonal mutations
[27–29]. However, new mutations may accumulate over
time and the risk of progression may change during the
disease course. Testing of multiple tumours (synchronous
and metachronous) from individual patients revealed high
intrapatient concordance, as expected according to the
field-cancerisation model. However, as multiple tumours
from only 71 patients among the entire cohort were
included in the analysis, the impact of prognostic perfor-
mance during analysis of multiple tumours needs to be
evaluated further. We do expect that multiple testing
during the disease course will provide more robust
estimates of disease development and risk over time.
Combining the test with measurements of circulating
tumour DNA in urine and plasma may increase the
probability of earlier detection of disease progression
[30] .A limitation was the relatively low progression rate (5%,
37/750). Continued follow-up for the patient cohort may
improve the prediction models; however, the progression
rate is close to the 5-yr progression rate that may be
expected in a consecutive series of patients with NMIBC
with no preselection of patients. Previous studies have
[(Fig._4)TD$FIG]
–4.00
3.00
–3.00
4.00
Progression score (FF)
Progression score (FFPE)
Cut-off FFPE
Cut-off (FF)
Fig. 4 – Correlation of progression scores obtained from analysis of
paired fresh frozen (FF) and formalin-fixed paraffin-embedded (FFPE)
tumours. The cut-off
optimal
values (broken lines) are shown for FFPE and
FF samples. Samples that showed different dichotomised progression
scores between FF and FFPE are marked in red.
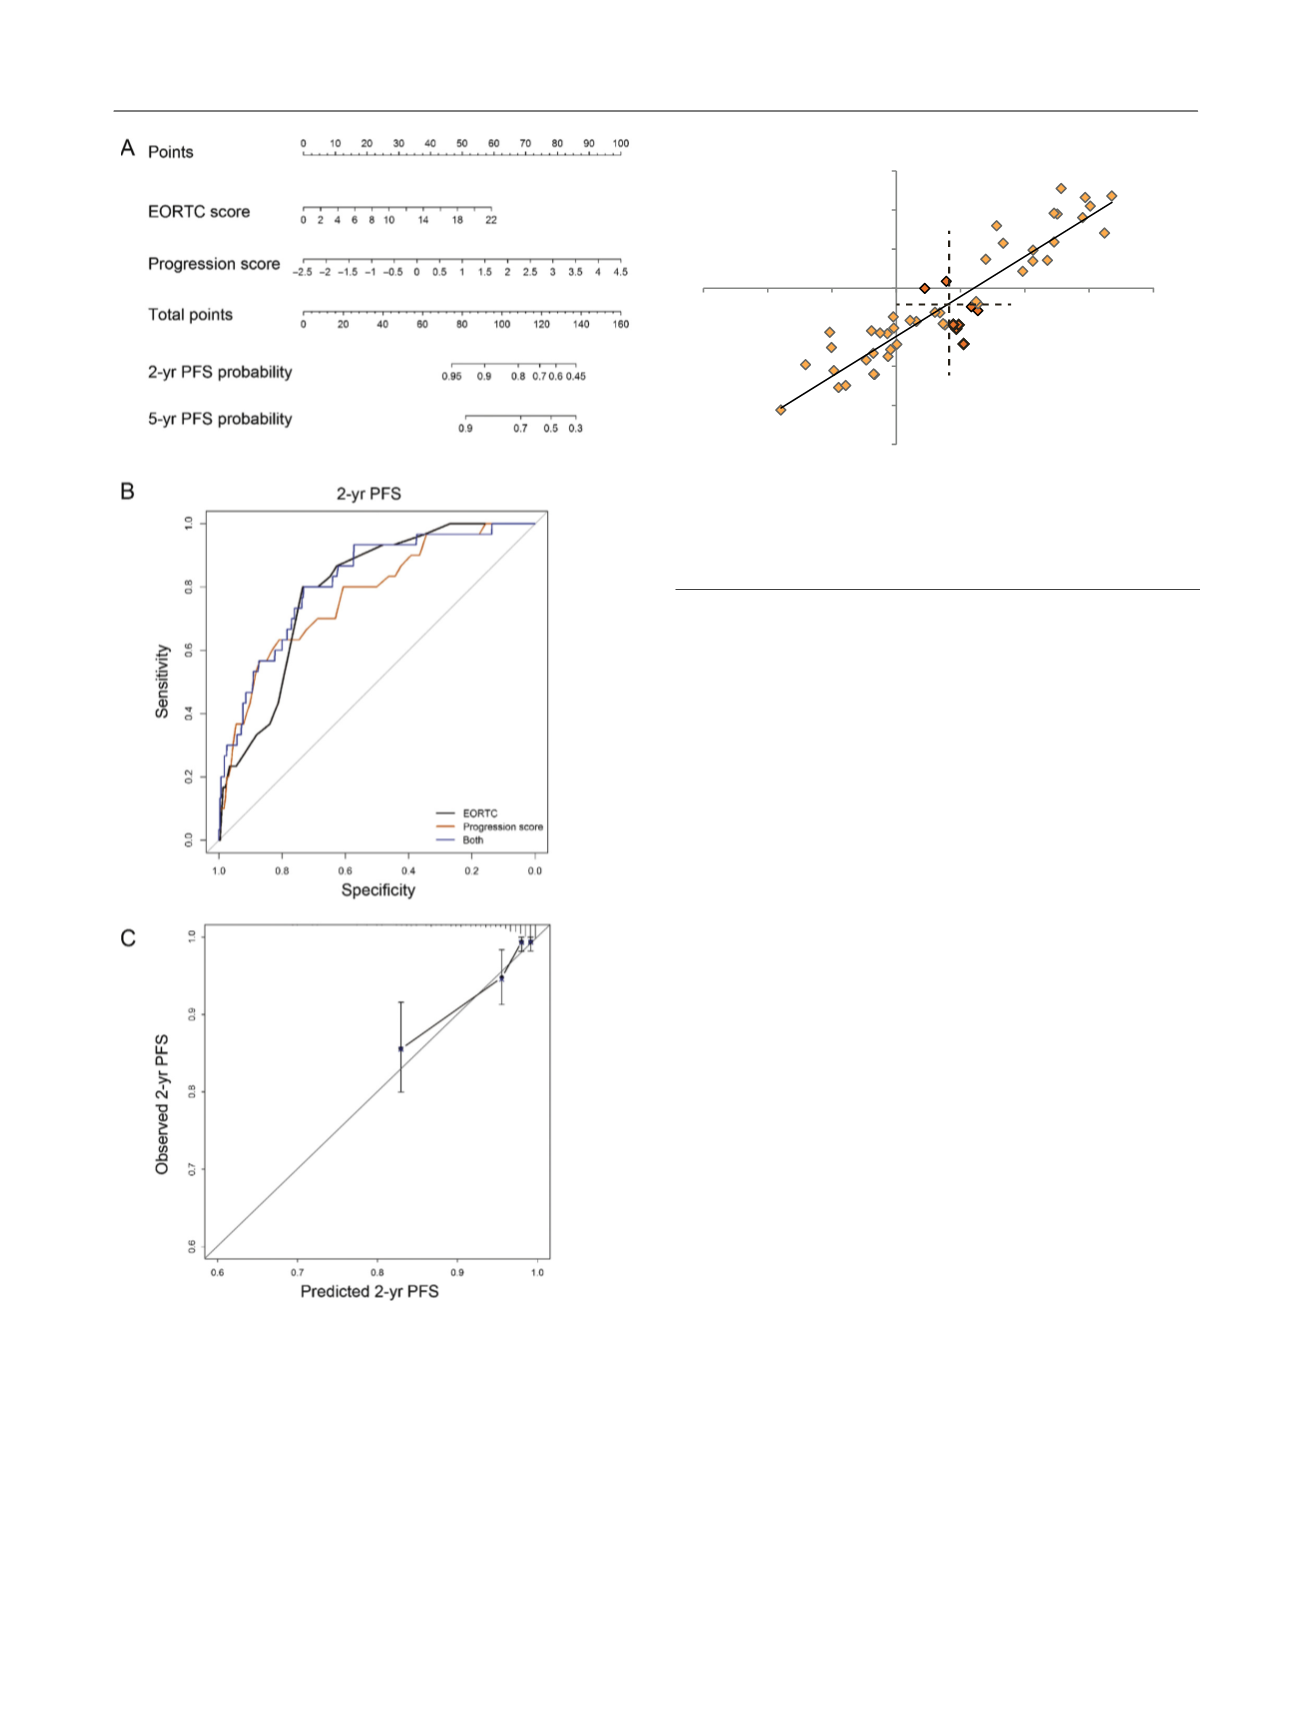
[(Fig._3)TD$FIG]
Fig. 3 – Combined analysis of continuous EORCT risk score and 12-gene
progression score. (A) Nomogram for 2-yr and 5-yr PFS probability
according to combined EORTC risk and progression scores. (B)
Receiver operating characteristic curves depicting sensitivity and
specificity for two-year PFS estimates for continuous EORTC risk score
and progression score separately and in combination. (C) Nomogram
calibration plot with 95% confidence intervals comparing observed
and predicted two-year PFS for the combined risk calculation.
EORTC = European Organisation for Research and Treatment of Cancer;
PFS = progression-free survival.
E U R O P E A N U R O L O G Y 7 2 ( 2 0 1 7 ) 4 6 1 – 4 6 9
467