


 466 476

FFPE tumour tissue, we performed a direct comparison. We
retrieved FFPE tumour blocks corresponding to 67 FF
tumours analysed and included in the previous analyses.
PCR amplification of all 12 genes was successful (average
Ct
[10_TD$DIFF]
<
30) in 52 cases. We found high correlation between
progression scores obtained from FF and FFPE material
(
R
2
[10_TD$DIFF]
= 0.85), with a shift in progression score from FF to FFPE
of 1.23. The average shift in Ct value from FF to FFPE was
4.6 (range 21.5–26.1). Based on this, the FFPE cut-off
optimal
is 0.42 and FFPE cut-off
90% sensitivity
is 1.40. A comparison
of the progression score from FF and FFPE tissues is shown
in
Fig. 4. Cut-off
optimal
is shown for FF and FFPE samples, and
nine of 52 samples showed a change in dichotomised
progression score between FF and FFPE analysis.
4.
Discussion
Several biomarkers with prognostic potential have been
identified, but few have been validated in independent
patient cohorts
[18]. Previous studies of NMIBC have shown
that
FGFR3
mutation status and Ki67 staining in combina-
tion (molecular grading) were superior to pathological
grade for predicting progression
[19–21] .Furthermore,
[(Fig._2)TD$FIG]
All patients
EORTC high risk patients (>6)
A
B
C
EORTC intermediate risk patients (>0 and ≤ 6)
p
< 0.001
Cut-off
optimal
0
5
10
15
20
318
224
104
30
0
343
279
117
23
0
Number at risk
0
20
40
60
80
Time (mo)
LOW RISK (Prog = 7)
HIGH RISK (Prog = 30)
p
< 0.001
Cut-off
90%sens
489
363
170
42
0
172
140
51
11
0
Number at risk
0
20
40
60
80
LOW RISK (Prog = 1)
HIGH RISK (Prog = 36)
p
= 0.035
Cut-off
optimal
172
105
46
15
0
75
55
22
2
0
Number at risk
0
20
40
60
80
LOW RISK (Prog = 4)
HIGH RISK (Prog = 25)
p
= 0.041
Cut-off
90%sens
219
138
60
17
0
28
22
8
0
0
Number at risk
0
20
40
60
80
LOW RISK (Prog = 0)
HIGH RISK (Prog = 29)
p
= 0.27
Cut-off
optimal
101
84
39
12
0
143
117
53
14
0
Number at risk
0
20
40
60
80
LOW RISK (Prog = 3)
HIGH RISK (Prog = 5)
p
= 0.37
Cut-off
90%sens
176
144
71
20
0
68
57
21
6
0
Number at risk
0
20
40
60
80
LOW RISK (Prog = 1)
HIGH RISK (Prog = 7)
Cumulative incidence of progression (%)
Cumulative incidence of progression (%)
Cumulative incidence of progression (%)
Time (mo)
Time (mo)
Time (mo)
Time (mo)
Time (mo)
0
5
10
15
20
0
5
10
15
20
0
5
10
15
20
0
5
10
15
20
0
5
10
15
20
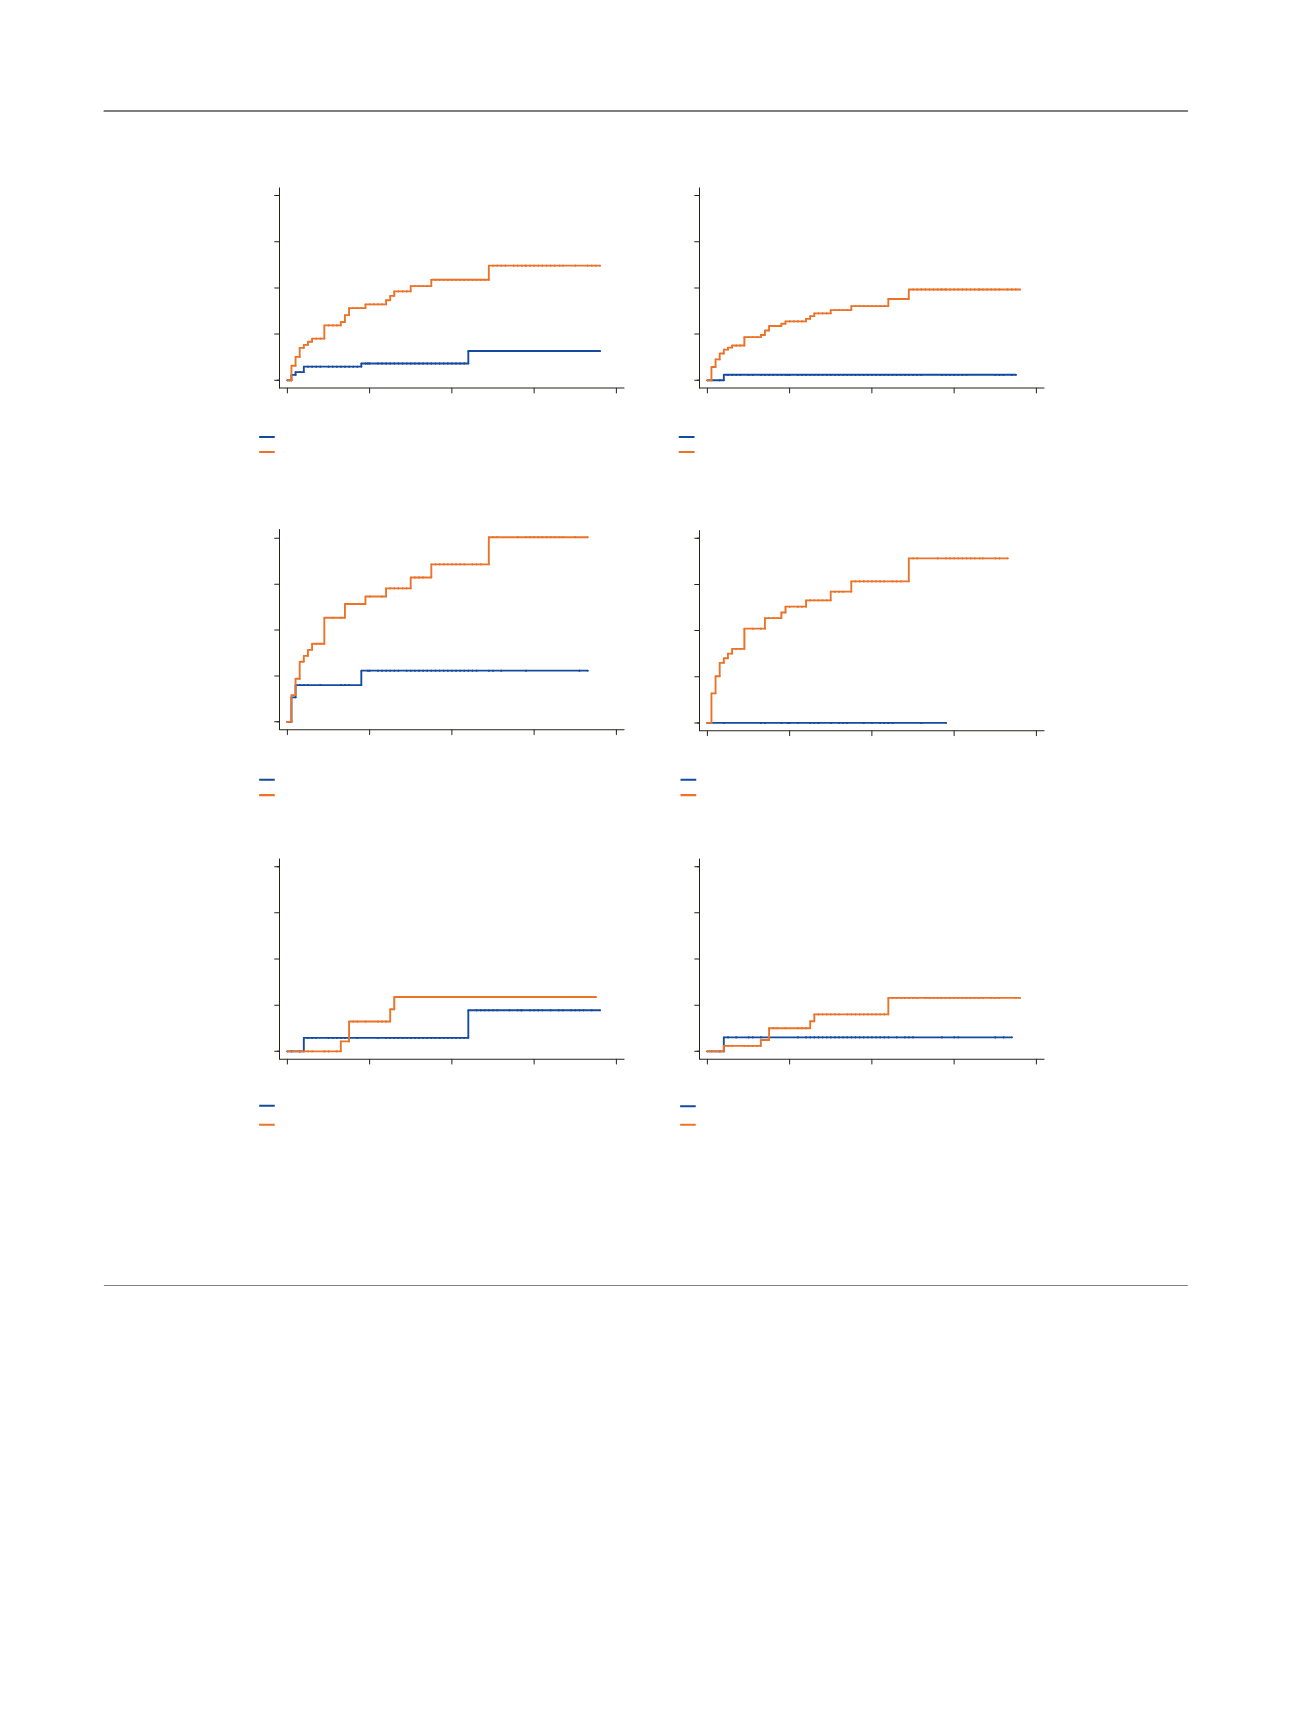
Fig. 2 – Correlation of the progression score and outcome in non–muscle-invasive bladder cancer. Kaplan-Meier estimates of cumulative incidence of
progression as a function of molecular classification of the first tumour included tumour for (A) all patients, (B) EORTC high-risk patients (risk >6),
and (C) EORTC intermediate-risk patients (risk >0 and
=
6). No progression events occurred in the EORTC low-risk group (risk = 0). Cumulative
incidence curves to the left are based on cut-off
optimal
and cumulative incidence curves to the right on cut-off
90% sensitivity
. Blue and red lines indicate
patients classified as low risk and high risk, respectively. The number of progression events (Prog) is indicated for each patient group.
EORTC = European Organisation for Research and Treatment of Cancer.
E U R O P E A N U R O L O G Y 7 2 ( 2 0 1 7 ) 4 6 1 – 4 6 9
466