


 414 476

3.2.1.
Urothelial cell cancer
For advanced UCC, one RCT was identified in which
542 patients with disease progression after first-line
platinum-based chemotherapy were randomized to receive
pembrolizumab (200 mg intravenously every 3 wk)
or investigator’s choice of chemotherapy (docetaxel,
paclitaxel, or vinflunine)
[23]. Patients treated with
pembrolizumab had significantly longer median OS than
those treated with investigator’s choice of chemotherapy
(10.3 vs 7.4 mo). Although there was no significant
between-group difference for PFS (HR for disease progres-
sion or death, 0.98 [95% CI, 0.81–1.19],
p
= 0.42), the
estimated PFS rate at 12 mo was higher for pembrolizu-
mab-treated patients (16.8% vs 6.2%, no HR reported). The
ORR was almost two-fold higher for the pembrolizumab
group as compared with the chemotherapy group (21.1% vs
11.4%,
p
= 0.001). Among patients with a tumor response
during pembrolizumab treatment, 7% had a complete
response and 14.1% had a partial response. In the
pembrolizumab group, the median duration of response
was not reached, whereas the median response duration
was 4.3 mo in the chemotherapy group. PD-L1 expression
was determined on pretreatment, mainly archival, tumor
tissue. A combined positivity score was used, defined as the
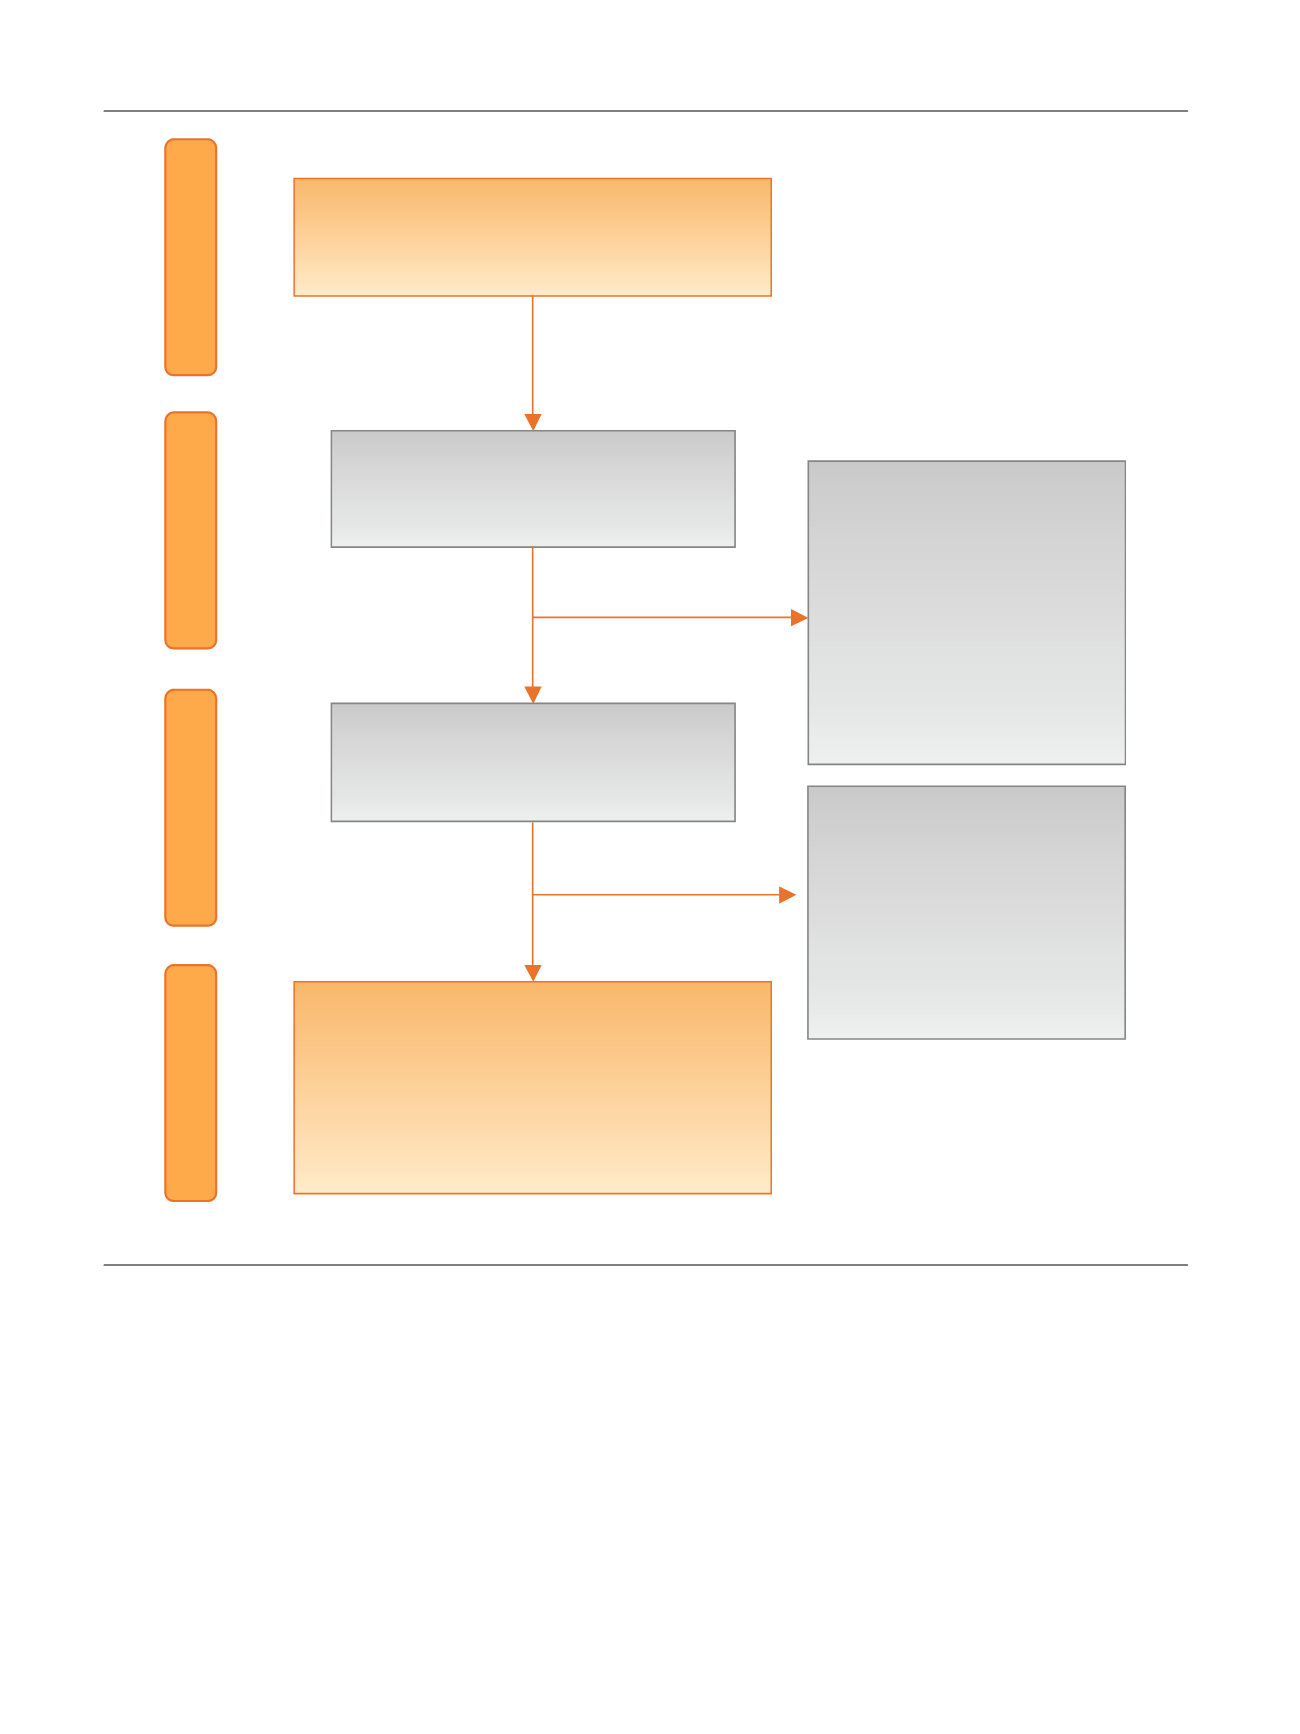
[(Fig._2)TD$FIG]
Records idenƟfied through database
searching
(
n
= 3354)
Screening
Included
Eligibility
IdenƟficaƟon
Records screened aŌer duplicates
removed
(
n
= 2083)
Records excluded aŌer Ɵtle
and abstract review
(
n
= 2043)
Exclusion criteria
: nonclinical
trials, reviews, editorials,
leƩers, case reports, basic
science studies, arƟcles on
other tumor types
Full-text arƟcles assessed for
eligibility
(
n
= 40)
Records excluded aŌer full
text evaluaƟon
(
n
= 34)
Exclusion criteria
:
nonrandomized trials, mixed
paƟent populaƟon, different
outcome measures
Studies included in quanƟtaƟve synthesis
(
n
= 6)
Urothelial cell cancer (
n
= 1)
Renal cell cancer (
n
= 3)
Prostate cancer (
n
= 2)
Fig. 2 – Evidence synthesis flowchart according to PRISMA. PRISMA = Preferred Reporting Items for Systematic Reviews and Meta-Analyses.
E U R O P E A N U R O L O G Y 7 2 ( 2 0 1 7 ) 4 1 1 – 4 2 3
414