


 362 476

and amplification of
PPARG
,
GATA3, ERBB2
, and
E2F3/SOX4
( Fig. 4 ).
4.
Conclusions
Molecular subtypes of bladder cancer are enriched with
specific genetic alterations. As recognized previously
[[57_TD$DIFF]
68],
basal/SCC-like MIBCs frequently contain
RB1
mutations, a
property that they share with basal-like breast cancers
[[72_TD$DIFF]
79,80]. Basal/SCC-like MIBCs are also enriched with
NFE2L2
mutations, which have also been identified in lung and head
and neck squamous cancers
[[18_TD$DIFF]
21,22]. Luminal tumors
contain more alterations in
FGFR3
and
KDM6A
(also known
as
UTX
) genes that are more commonly mutated in NMIBCs
as compared with that in MIBCs
[1]. These observations
support the emerging conclusion that
FGFR3
mutations
mark the luminal MIBCs that correspond to the papillary
NMIBCs that have progressed to become muscle invasive.
Alterations affecting several transcription factors that
appear to play important roles in urothelial terminal
differentiation
[[73_TD$DIFF]
81,82](PPARG
,
GATA3
,
RXRA
, and
ELF3)
were also enriched in luminal cancers. Biological effects of
these alterations will need to be explored in future
functional studies.
The Lund subclassifications divide the UNC/MD Ander-
son/TCGA basal/SCC-like and luminal subtypes in ways that
have important biological and clinical implications. Al-
though they cluster together with the squamous/basal
tumors in the UNC, MD Anderson, and TCGA classifications,
the genetic alterations in the uroB tumors more closely
resemble those present in the luminal uroA subtype,
supporting the conclusion that they represent progressed
versions of the uroA cancers. The precise mechanisms that
cause them to appear more ‘‘basal’’ (at the molecular level,
and also in terms of their enrichment with squamous
histological features and lethality) will be very interesting;
their relatively high content of
RB1
and
NFE2L2
mutations
suggests possible mechanisms. The existence of uroB
tumors also suggests that basal versus luminal subtype
class ‘‘switching’’ is possible. Clinically, it will be interesting
to determine whether the uroA and uroB tumors are equally
sensitive to FGFR inhibitors.
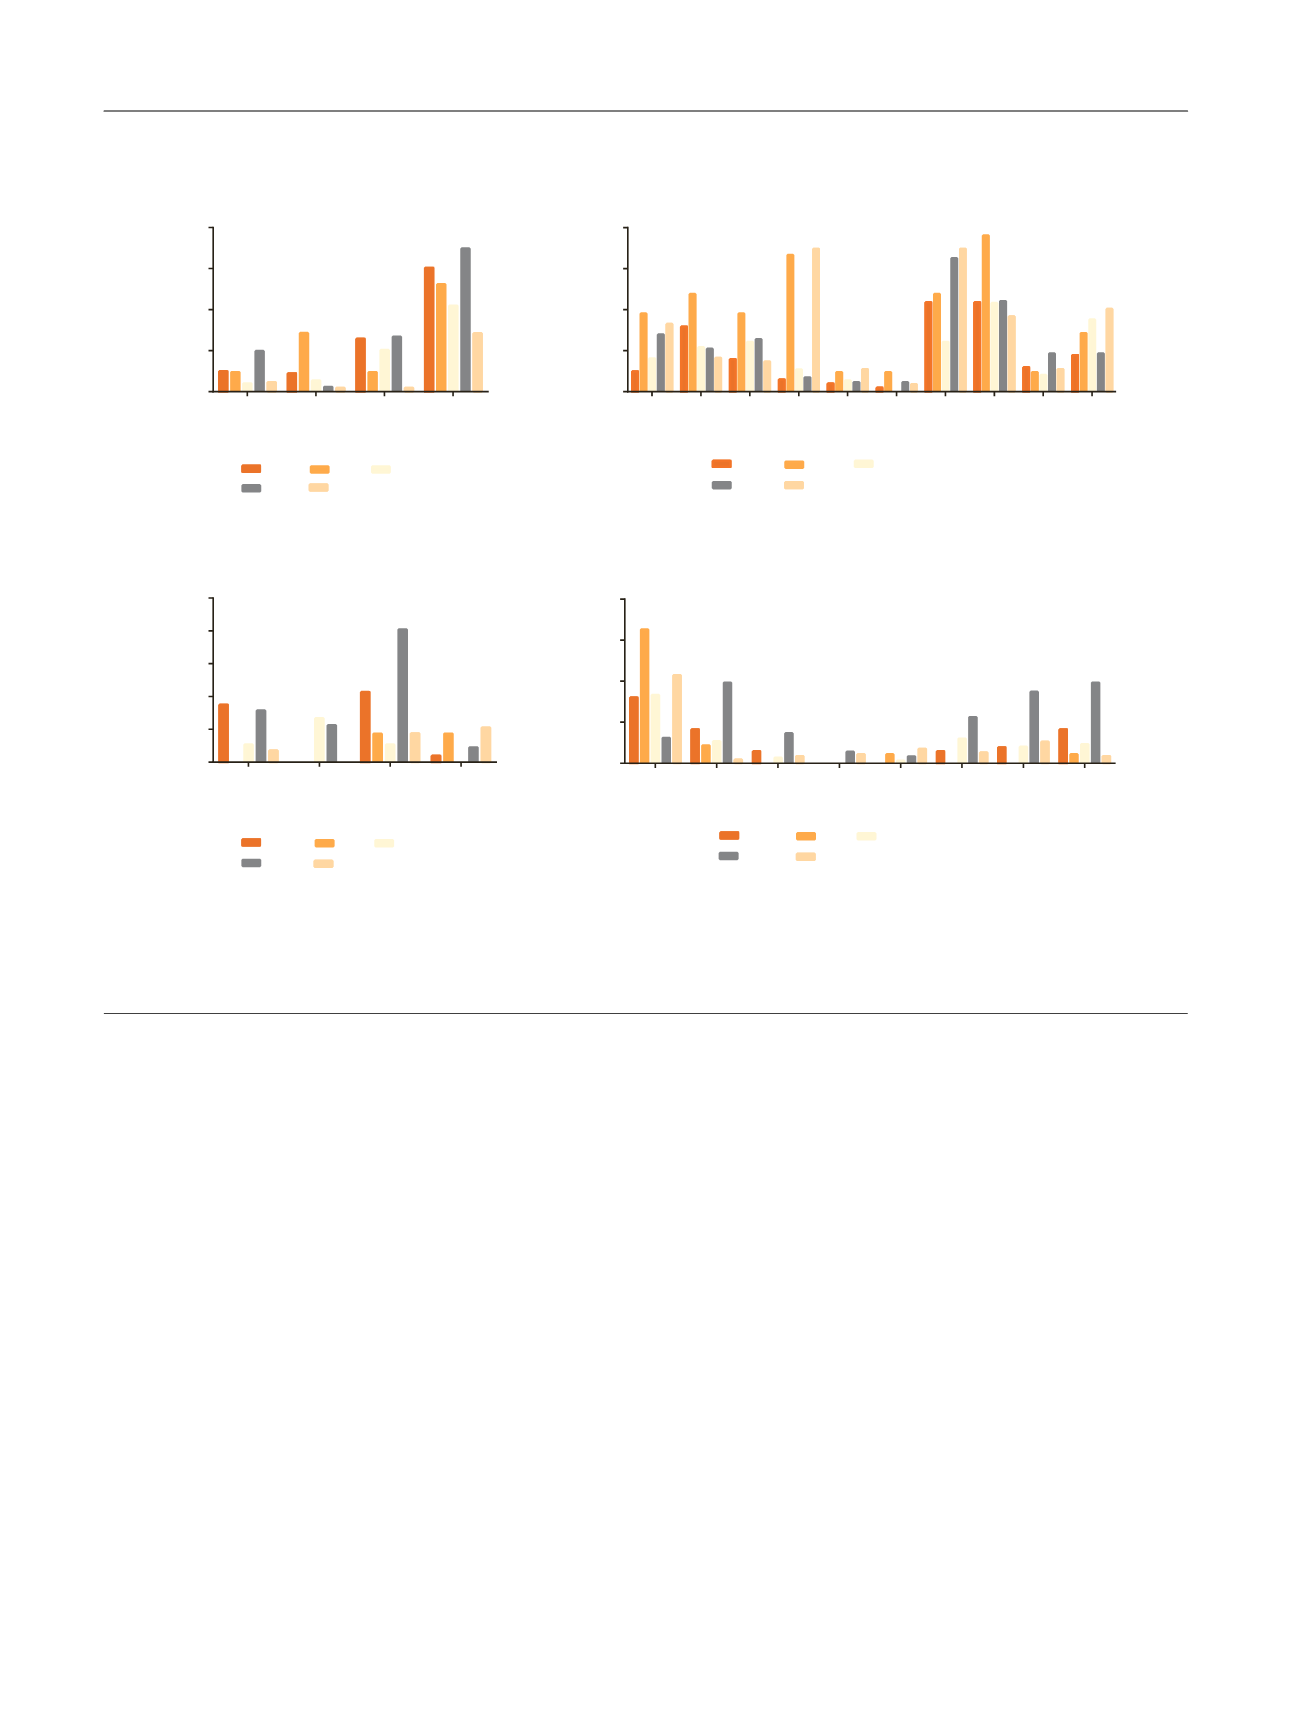
[(Fig._4)TD$FIG]
ERCC2
NFE2L2
RB1
TP53
0
20
40
60
80
Basal
% of samples
SCCL
UroB Infil
GU
UroA
*
*
*
*
ELF3
ERBB2
ERBB3
FGFR3
FOXA1
GATA3
KDM6A
PIK3CA
RXRA
STAG2
0
10
20
30
40
Luminal
% of samples
SCCL
UroB
Infil
GU
UroA
*
*
EGFR
ERCC2
RB1_DEL
TP53_DEL
0
5
10
15
20
25
Basal
% of samples
SCCL
UroB Infil
GU
UroA
*
CDKN2A_DEL
E2F3
ERBB2
ERBB3
FGFR3
GATA3
PPARG
SOX4
0
20
40
60
80
Luminal
% of samples
SCCL
UroB Infil
GU
UroA
*
*
*
*
*
Mutation (Lund)
CNA (Lund)
Fig. 4 – Enrichment of significantly mutated genes and CNAs in the Lund subtypes. Alterations are grouped according to predicted enrichment in basal
versus luminal tumors, and the results are displayed as percentages of tumors in each subtype that contained the indicated alteration. The CNAs
correspond to chromosomal amplification unless specifically identified as deletions (‘‘del’’). Fisher’s exact test was used to determine differences
between subtypes. CNA = copy number aberration; GU = genomically unstable; Infil = infiltrated; SCCL = squamous cell carcinoma like; uroA = urobasal
A; uroB = urobasal B. *
p
< 0.05 was considered significant.
E U R O P E A N U R O L O G Y 7 2 ( 2 0 1 7 ) 3 5 4 – 3 6 5
362