


 359 476

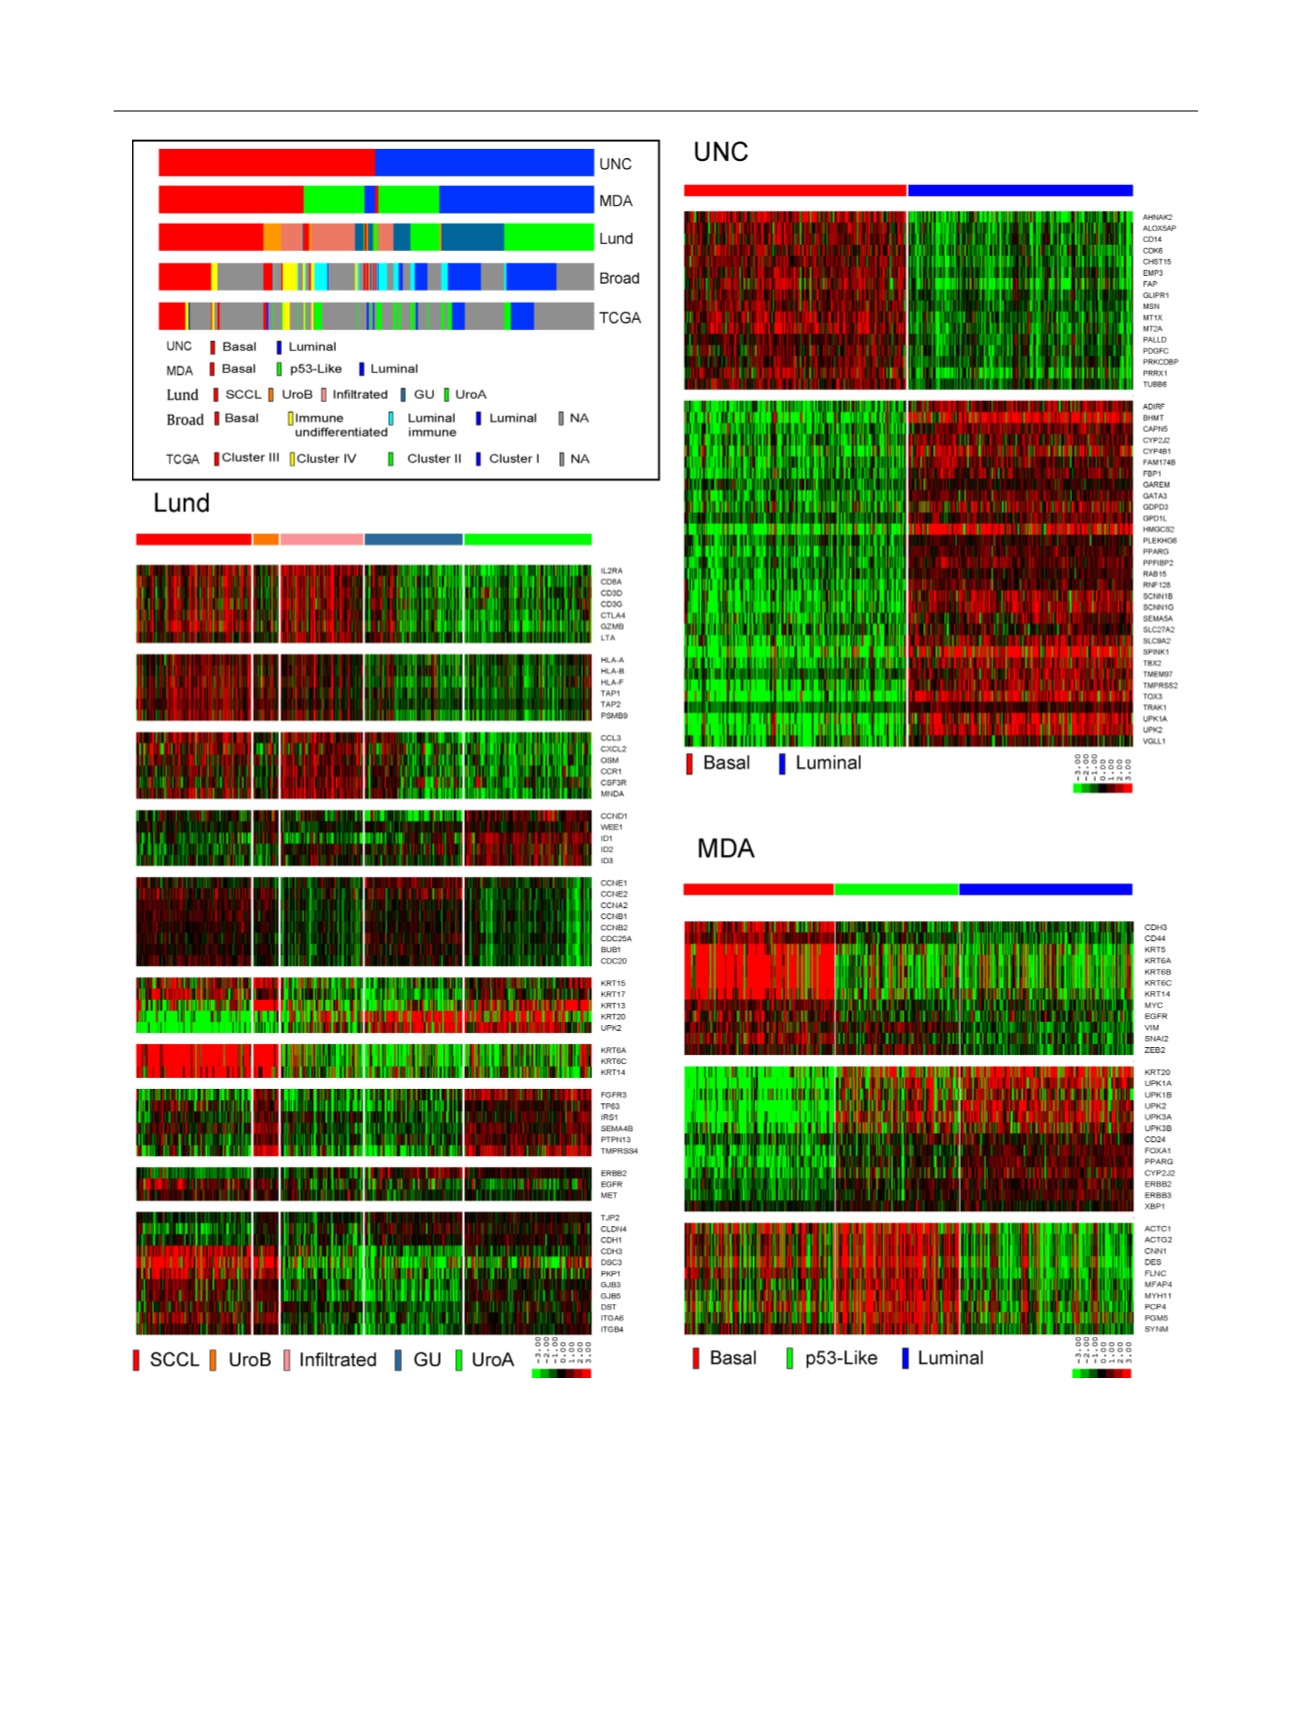
[(Fig._1)TD$FIG]
Fig. 1 – Comparison of subtype calls in TCGA’s final dataset. Each group used TCGA’s normalized RNA-seq data to assign TCGA’s tumors to the UNC, MD
Anderson, or Lund subtypes. Published calls made by a group at The Broad Institute
[[5_TD$DIFF]
18]and TCGA were also included for comparison. The top left
panel provides a schematic overview of the relationships among the calls made by the five groups. The heat maps display the relative expression of
the gene sets that characterize each group’s subtypes. The red and green colors correspond to high and low relative expression, respectively.
GU = genomically unstable; MDA = MD Anderson; NA = not applicable; SCCL = squamous cell carcinoma like; TCGA = The Cancer Genome Atlas;
UNC = University of North Carolina; uroA = urobasal A; uroB = urobasal B.
E U R O P E A N U R O L O G Y 7 2 ( 2 0 1 7 ) 3 5 4 – 3 6 5
359