


 360 476

infiltration and tumor PDL1 expression are actually highest
in TCGA cluster IV, which corresponds to a subset of
‘‘mesenchymal’’ basal tumors
[[66_TD$DIFF]
76] ,and this connection
between EMT and immune infiltration and tumor PDL1
expressionwas observed across solid tumors in a recent pan-
cancer analysis
[[67_TD$DIFF]
77]. Therefore, even though TCGA cluster IV
tumors are heavily infiltrated with lymphocytes, the T cells
appear to be more actively suppressed than are the T cells in
the tumors that belong to TCGA cluster II luminal subtype
[[66_TD$DIFF]
76] ,which could explain why cluster IV tumors are
somewhat less sensitive to immune checkpoint blockade.
It could be noteworthy that atezolizumab provided maximal
benefit in a portion of the tumors that belonged to the
subtype that had been previously defined as being more
resistant to conventional chemotherapy
[[63_TD$DIFF]
67,73]. In other
words, if the findings are validated, cisplatin-based chemo-
therapy and atezolizumab may produce clinical benefit in
complementary populations of patients.
3.5.
Genomic alterations in molecular subtypes of MIBC
Given past observations in the molecular subtypes in other
cancers, it seemed likely that the molecular subtypes of
bladder cancer would contain distinct mutations and CNAs.
To test this hypothesis, we established a collaboration to
assign the tumors from the complete TCGA RNA-seq dataset
(
n
= 408) to subtypes using the classifiers developed at UNC,
MD Anderson, and Lund University. We also obtained the
subtype calls from the original TCGA marker paper
[[15_TD$DIFF]
17]and
the subsequent analyses performed by the group at the
Broad Institute
[68_TD$DIFF]
(
n
= 238 tumors)
[[5_TD$DIFF]
18], in order to compare
the calls with those made by our groups. We then examined
each subtype for its content of specific DNA mutations
(
n
= 391,
available from Firehose
[ https://gdac. broadinstitute.org/]) and CNAs (
n
= 404, available from
cBioportal
[ http://www.cbioportal.org/]). The results con-
firmed the patterns of subtype overlap noted in a recent
study
[[59_TD$DIFF]
69]. Specifically, the UNC basal-like subtype
contained almost all the MD Anderson basal, Lund SCCL,
and Broad basal tumors, and TCGA clusters III and IV
( Fig. 1),
strongly supporting the consensus view that the basal/SCC-
like subtype is consistently observed in muscle-invasive
tumors
[[69_TD$DIFF]
78]. The UNC basal-like subtype also contained half
of the MD Anderson p53-like, most of the Lund uroB and
infiltrated, and all the Broad immune undifferentiated
tumors
( Fig. 1 ). The UNC luminal subtype contained almost
all the MD Anderson luminal tumors, half of the MD
Anderson p53-like tumors, most of the Lund GU and uroA
tumors, most of the Broad luminal immune and luminal
tumors, and TCGA clusters I and II
( Fig. 1 ).
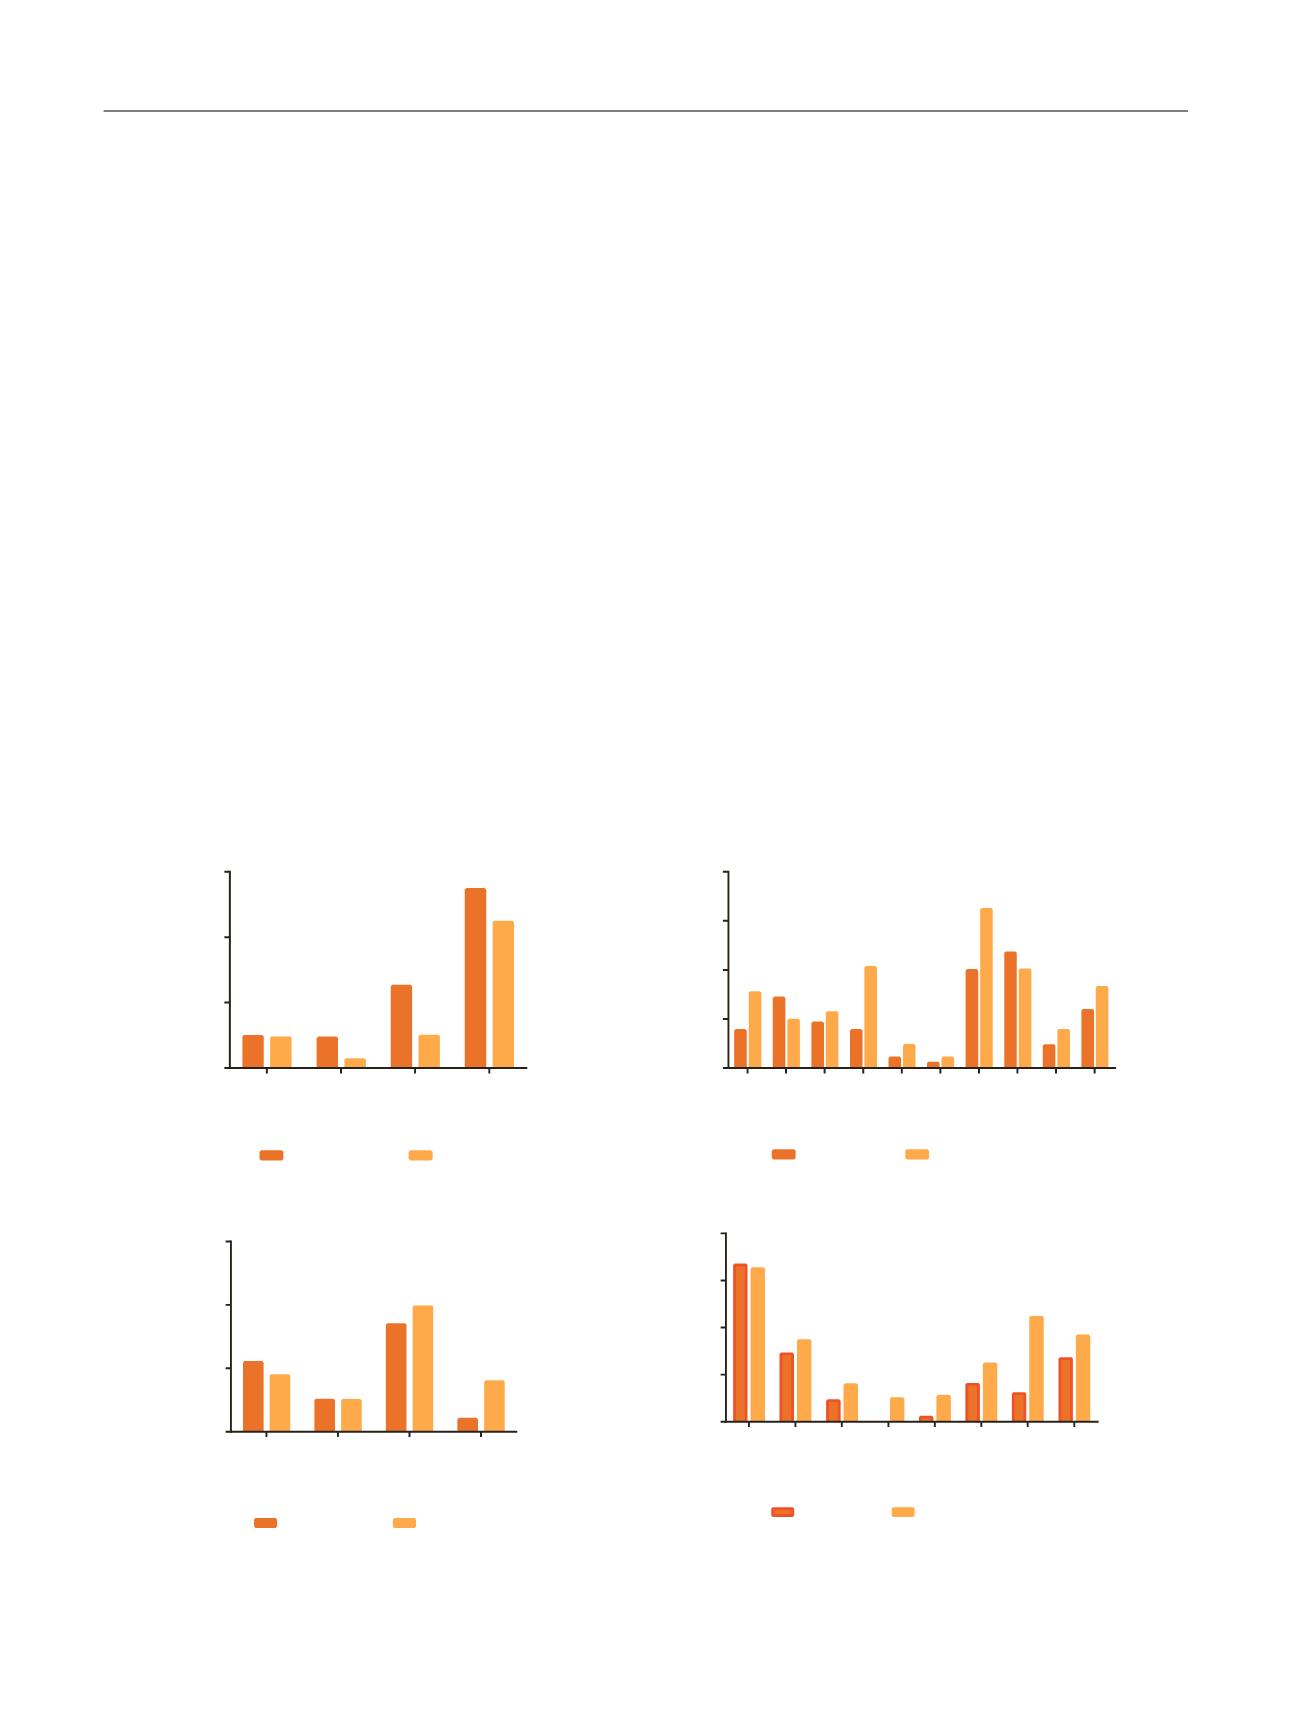
[(Fig._2)TD$FIG]
ERCC2
NFE2L2
RB1
TP53
0
20
40
60
Basal
Basal-like
Luminal
*
*
ELF3
ERBB2
ERBB3
FGFR3
FOXA1
GATA3
KDM6A
PIK3CA
RXRA
STAG2
0
10
20
30
40
Luminal
Basal-like
Luminal
*
*
*
EGFR
ERCC2
RB1_DEL
TP53_DEL
0
5
10
15
Basal
% of samples
% of samples
% of samples
% of samples
Basal-like
Luminal
CDKN2A_DEL
E2F3
ERBB2
ERBB3
FGFR3
GATA3
PPARG
SOX4
0
10
20
30
40
Luminal
Basal-like
Luminal
* *
*
Mutation (UNC)
CNA (UNC)
Fig. 2 – Enrichment of significantly mutated genes and CNAs in the UNC subtypes. Alterations are grouped according to predicted enrichment in basal
versus luminal tumors, and the results are displayed as percentages of tumors in each subtype that contained the indicated alteration. The CNAs
correspond to chromosomal amplification unless specifically identified as deletions (‘‘del’’). Fisher’s exact test was used to determine differences
between subtypes. CNA = copy number aberration; UNC = University of North Carolina. *
p
< 0.05 was considered significant.
E U R O P E A N U R O L O G Y 7 2 ( 2 0 1 7 ) 3 5 4 – 3 6 5
360