


 383 476

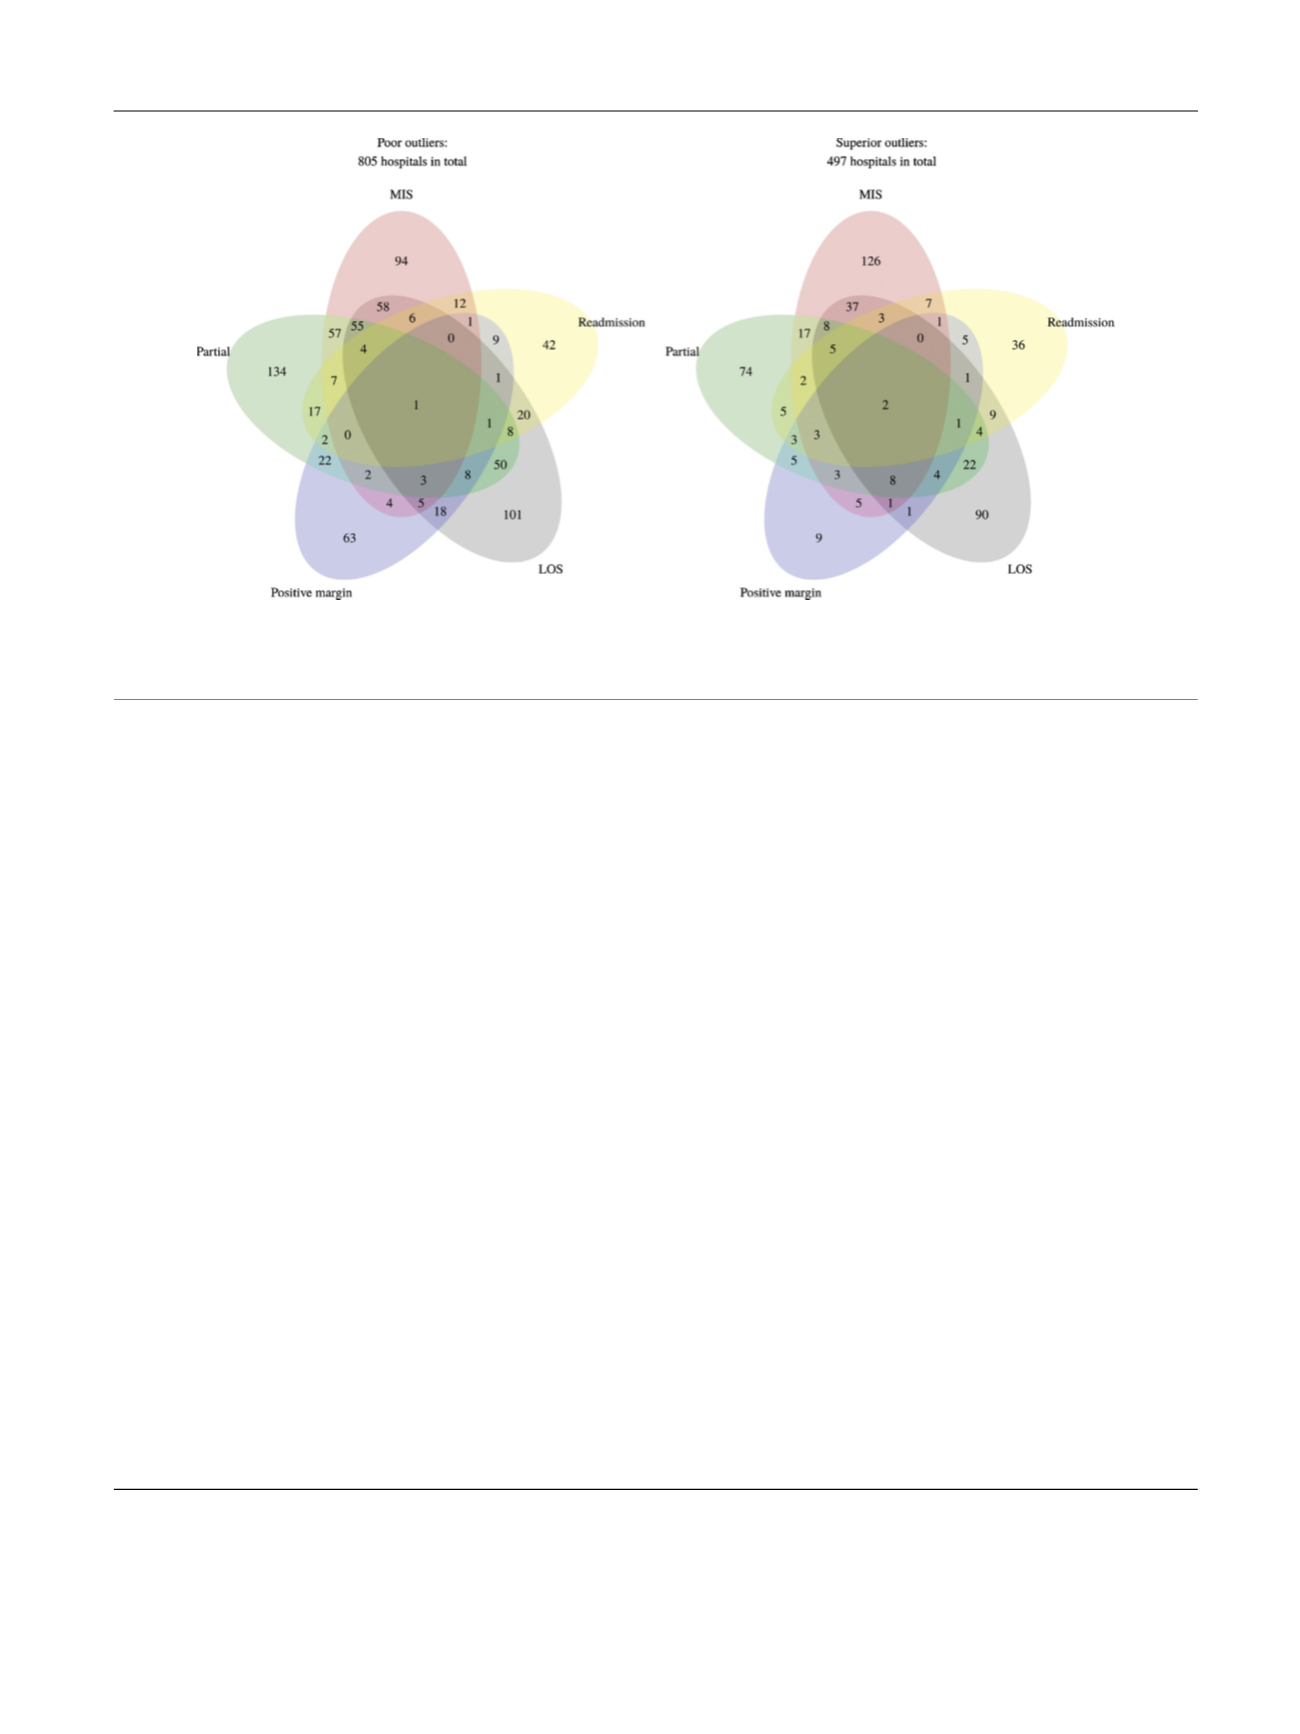
of 27%, 31%, 12%, 27%, and 10% of hospitals were identified
as delivering lower than expected care (poor-outliers) per
the MIS, PN, PM, LOS, and RP indicators, respectively, with
funnel plots
[16]summarizing results displayed in
Figure 1. Concordance among the QIs for identifying outlier
hospitals (superior and poor) is displayed in
Figure 2 .While
certain individual QIs demonstrated significant concor-
dance (eg, MIS and LOS; Supplementary Table 2) the overall
concordance (Chronbach
a
0.25) observed collectively was
small, with many identifying unique outliers.
To better understand possible structural elements
driving quality variations we evaluated associations be-
tween hospital outlier status and hospital volume, facility
type (ie, academic status), and geographical location. A
Renal Cancer Quality Score (RC-QS), representative of the
overall performance of a hospital across the five QIs, was
determined to facilitate this analysis; hospital distribution
by RC-QS is displayed in Supplementary Figure 2. Overall,
hospitals with a positive RC-QS (ie, superior performance)
were associated with higher volume and academic affilia-
tion relative to hospitals with a negative sum score
(
p
<
0.001;
Figure 3). This was confirmed when the QIs
were analyzed independently, with superior-outlier hospi-
tals demonstrating higher volume and academic affiliation
relative to poor outlier hospitals (Supplementary Figs. 3 and
4). Minimal variation in quality was observed across
geographical locations
( Fig. 3 ).
We then assessed the impact of quality variation on patient
outcomes. Odds ratio (OR) and hazard ratios (HR)
[36_TD$DIFF]
summariz-
ing associations between RC-QS and 30-d, 90-d, and overall
mortality rates are displayed in
Figure 4. Overall, a higher RC-
QS portended a decrease in 30-d, 90-d, and overall mortality
(unadjusted OR [
[37_TD$DIFF]
95% confidence interval]: 0.91 [
[38_TD$DIFF]
0.88–0.94],
OR: 0.93 [0.91–0.96], HR: 0.96 [0.95–0.97] per unit increase,
respectively). This association remained after multivariable
modeling of patient and tumor case-mix factors, with each
point increase in RC-QS portending a
[39_TD$DIFF]
8%, 6% lower odds of 30-
d, 90-d mortality, and 3% lower overall mortality rate,
respectively (adjusted OR [
[37_TD$DIFF]
95% confidence interval]:
[40_TD$DIFF]
0.92 [0.90–0.95], OR: 0.94 [
[41_TD$DIFF]
0.91–0.96], HR: 0.97 [0.96–0.98]
per unit increase, respectively). When assessed individually,
significant quality-mortality associations were observed for
the MIS, PN, RP, and PM indicators (Supplementary Fig. 5).
4.
Discussion
Healthcare continues to evolve towards increasing provider
accountability with the ultimate goal of maximizing the
quality of care being delivered. Consequently, significant
efforts towards developing hospital-level performance
metrics, or QIs, have been made. Despite this, a lack of
real-world data exists to validate many of the proposed QIs,
bringing into question their value in shaping health policy
decision-making, resource allocation, and educational
Fig. 1 – Benchmarking hospital performance reveals widespread variation in renal cancer surgical quality. Case-mix adjusted performance for
individual hospitals (circles, size proportional to hospital volume) benchmarked for quality according to T1-2 tumors receiving a minimally invasive
(laparoscopic or robotic) approach for radical nephrectomy, T1a tumors undergoing partial nephrectomy, positive surgical margin following PN for T1
tumors,
[16_TD$DIFF]
mean length of stay
[1_TD$DIFF]
and
[17_TD$DIFF]
readmission
[18_TD$DIFF]
proportion
[19_TD$DIFF]
for
[20_TD$DIFF]
T1-4 tumors undergoing radical nephrectomy. Vertical dashed
[2_TD$DIFF]
line represents the average
nationwide hospital performance. The y-axis represents the inverse standard error of the case-mix adjusted performance measure
[21_TD$DIFF]
.
[22_TD$DIFF]
The dashed
[2_TD$DIFF]
funnel
[23_TD$DIFF]
gives the 95% nonrejection region for the null of equivalence between observed and expected performance.
SE = standard error.
[(Fig._2)TD$FIG]
Fig. 2 – Concordance in identifying outlier hospitals between quality indicators. Venn diagram demonstrating
[24_TD$DIFF]
the overlap in the
[25_TD$DIFF]
number of
[26_TD$DIFF]
outlier
[27_TD$DIFF]
hospitals identified by the five
[28_TD$DIFF]
quality indicators
[29_TD$DIFF]
.
LOS = length of stay.
[30_TD$DIFF]
MIS = T1-2 tumors receiving a minimally invasive (laparoscopic or robotic) approach for radical nephrectomy.
E U R O P E A N U R O L O G Y 7 2 ( 2 0 1 7 ) 3 7 9 – 3 8 6
383