


 372 476

[(Fig._1)TD$FIG]
Patients
–100
–75
–50
–25
25
0
50
A
Best reduction from first progression
in target lesion (%)
Patients
25
–25
–50
–75
–100
0
50
Best reduction from first progression
in target lesion (%)
B
Patients
25
–25
–50
–75
–100
0
50
Best reduction from first progression
in target lesion (%)
C
Patients
25
–25
–50
–75
–100
0
50
Best reduction from first progression
in target lesion (%)
D
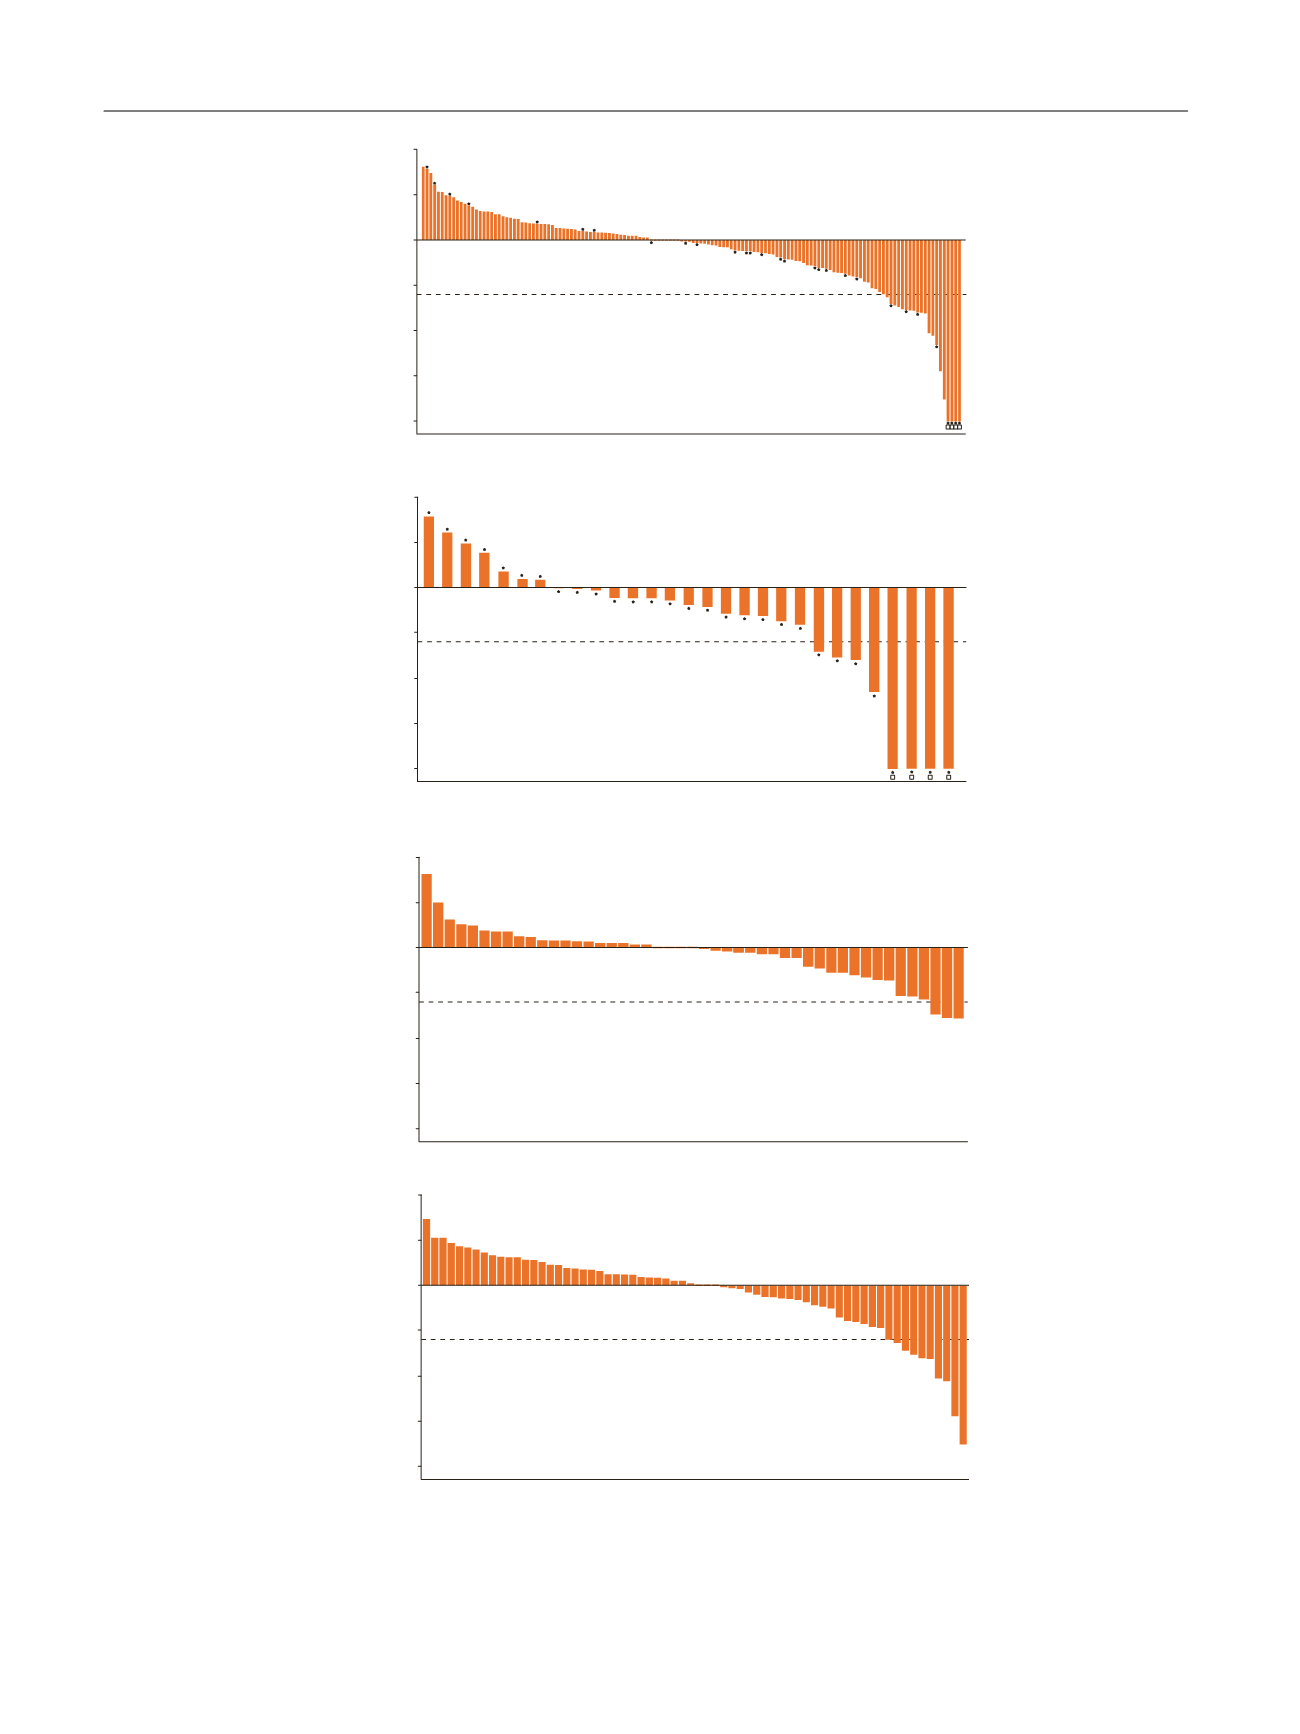
Fig. 1 – Best reduction after first progression in target lesion in all patients treated beyond progression with nivolumab
[3_TD$DIFF]
(A) and based on
[1_TD$DIFF]
best overall response
prior to treatment beyond progression of (B) complete/partial response, (C) stable disease, and (D) progressive disease. Asterisks represent responders before first
progression. Square symbols represent % change truncated to 100%.
[4_TD$DIFF]
Excludes patients who were treated beyond progression but did not have scans beyond first
progression to document tumor burden.
E U R O P E A N U R O L O G Y 7 2 ( 2 0 1 7 ) 3 6 8 – 3 7 6
372