


 349 476

absolute difference in prostate-cancer mortality between
radically treated and nonradically treated matched groups,
which translated to circa three-fold higher hazard for the
latter cohort (no differences in other-cause mortality were
seen).
Treating the primary lesion in disseminated disease is
the gold standard in several cancer types such as ovarian
and renal cell
[4–6,13] .Median survival from peritoneal
carcinomatosis from gastrointestinal cancer has increased
from 6 mo to
>
2 yr with cytoreductive surgery plus
intraperitoneal chemotherapy
[14]. A SEER-Medicare study
of 9011 metastatic colon cancer patients showed that 2-yr
survival increases from 8% in the chemotherapy-only group
to 30% in the chemotherapy-plus–removal of the primary
tumor group
[15].
There also exist data in prostate cancer; disseminated
tumor cells in men with localized prostate cancer before
radical prostatectomy confer a five-fold increased risk of
subsequent metastases, but when detected after surgery
there is no increased risk, suggesting that an intact primary
lesion promotes clinical metastases
[16–18] .A subgroup
analysis from SWOG-8894 of 1286 men with metastatic
prostate cancer showed a 23% reduction in mortality in
those who had undergone prior radical prostatectomy
compared with those who had not
[19]. Retrospective case
series on men with likely occult metastatic disease (PSA
>
50 or N + disease) have demonstrated a survival advan-
tage for surgery of the primary tumor compared with
systemic therapy alone
[2,20,21]. A recent SEER report of
mortality outcomes in men with metastatic prostate cancer
and treated with radical therapy demonstrated 5-yr overall
survival and disease-specific survival advantage for patients
who underwent surgery or brachytherapy compared with
the nonradically treated group
[7] .However, the study had a
short median follow-up (16 mo), no data on many
important predictors, small numbers in the surgery
(
n
= 245) and brachytherapy (
n
= 129) arms, no external
beam radiation group, and significant patient–tumor
differences between groups at baseline, and it was not a
true population-based study. Data from the Munich Cancer
Registry of metastatic prostate cancer showed 55% 5-yr
overall survival in the surgical group versus 21% in the
nonsurgical group
[22]; again, these data are limited: small
numbers in the surgical arm (
n
= 74) compared with the
nonsurgical arms (
n
= 1464), heterogeneity of nonsurgical
treatments, and no attempt to adjust for patient–tumor
differences between the groups.
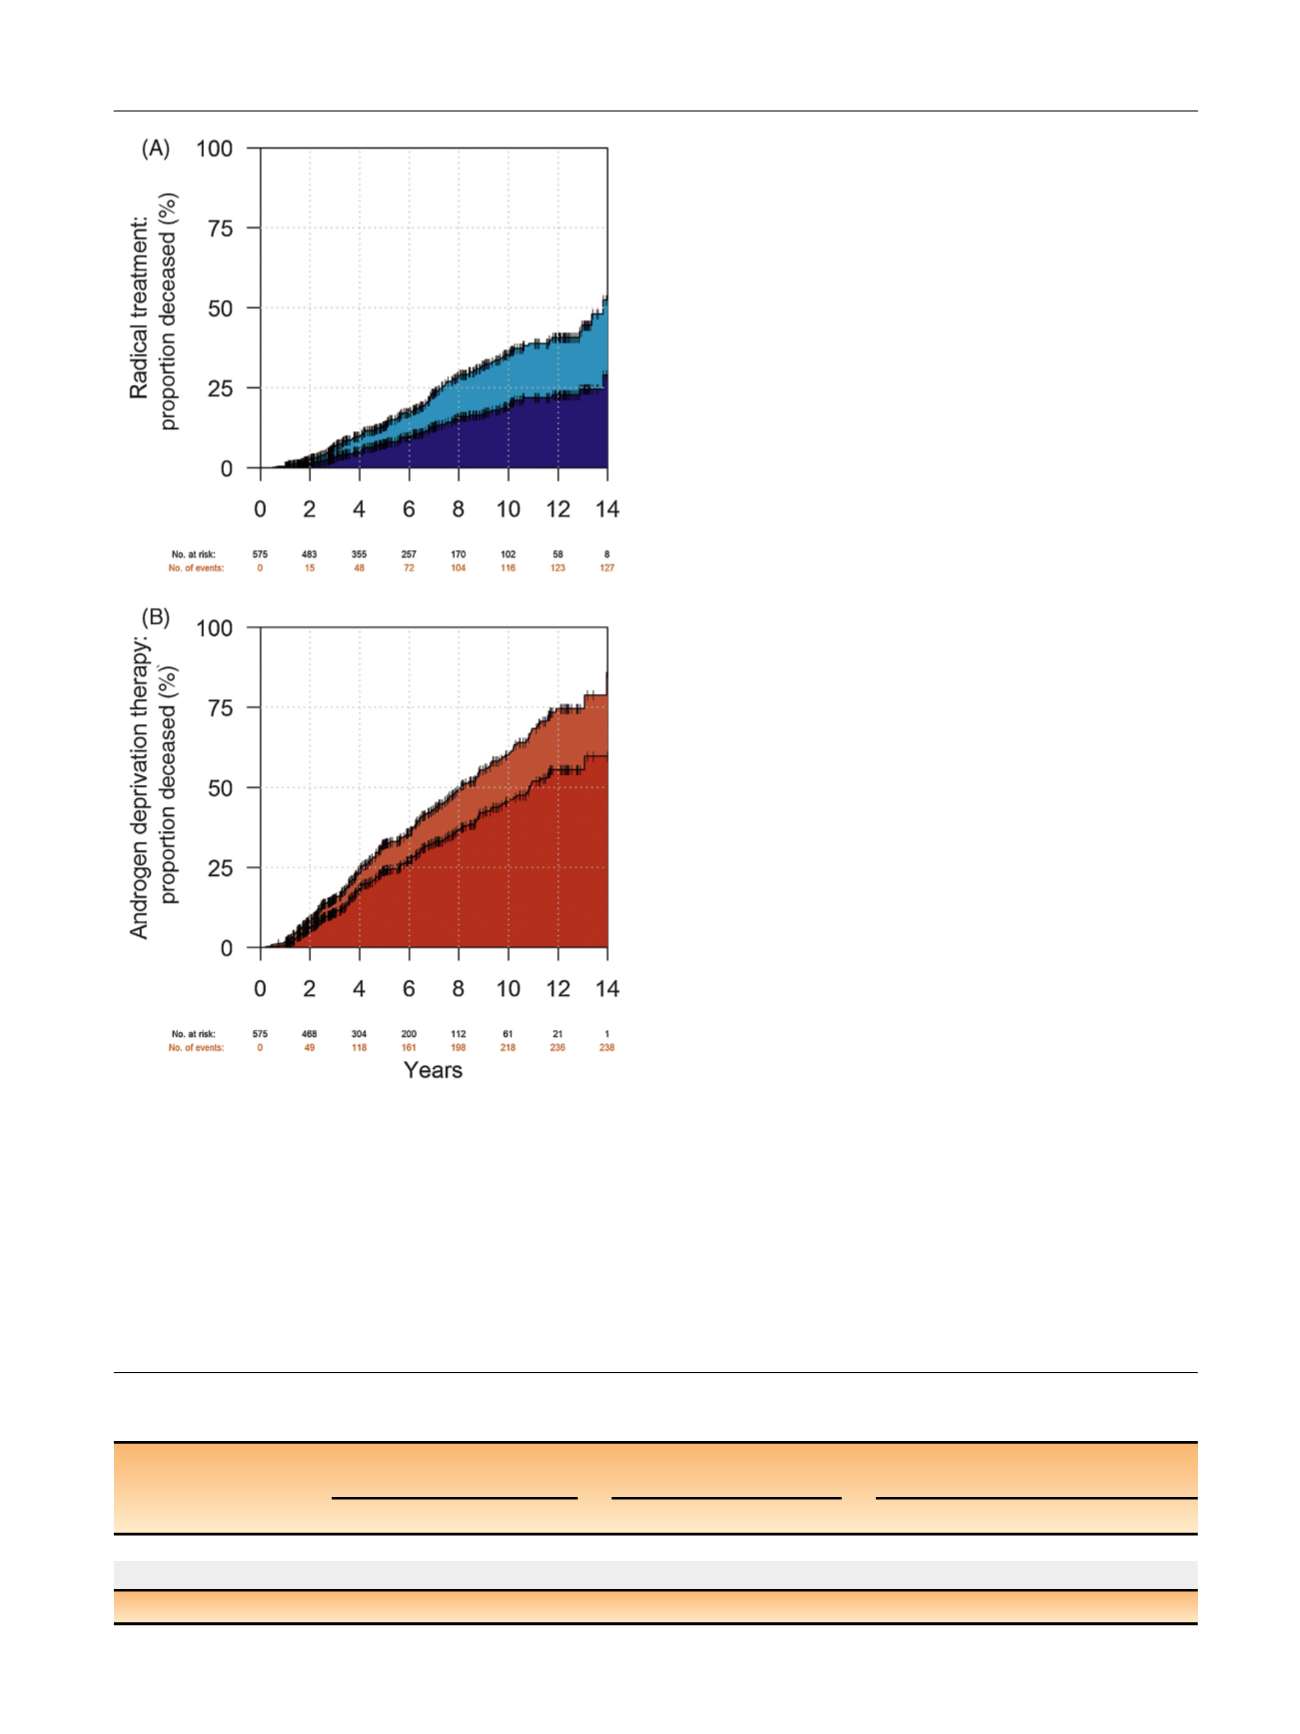
[(Fig._2)TD$FIG]
Fig. 2 – Cumulative incidence curves of prostate-cancer and other-cause
mortality for the cohort of (A) radically treated and (B) androgen
deprivation patients with PSA > 50 frequency matched by PSA, clinical
stage, M stage, tumor grade, Charlson comorbidity index, age, and year
of diagnosis (
n
= 1150). White = alive; light blue = other-cause mortality
in the radical therapy group; dark blue = prostate-cancer mortality in
the radical therapy group; light red = other-cause mortality in the
androgen deprivation group; and dark red = prostate-cancer mortality
in the androgen deprivation group. PSA = prostate-specific antigen.
Table 3 – Mortality figures and crude and multivariable model–adjusted subdistribution hazard ratios for androgen deprivation versus
radical therapy for prostate-cancer and other-cause mortality for the subgroup of frequency-matched PSA > 100 cases (
n
= 176)
No. of deaths
Crude sHR (95% CI)
p
value Multivariable model–adjusted
sHR (95% CI)
p
value
ADT
Radical treatment
ADT vs radical treatment
ADT vs radical treatment
Prostate-cancer mortality 38/88 (43%)
19/88 (22%)
2.66 (1.54–4.59)
<
0.001
2.93 (1.57–4.02)
<
0.001
Other-cause mortality
4/88 (4.5%)
8/88 (9.1%)
0.51 (0.15–1.67)
0.3
0.45 (0.12–1.17)
0.1
ADT = androgen deprivation therapy; CI = confidence interval; sHR = subdistribution hazard ratio.
E U R O P E A N U R O L O G Y 7 2 ( 2 0 1 7 ) 3 4 5 – 3 5 1
349