


 348 476

prostate-cancer mortality for ADT versus radical treatment
in this matched cohort
( Table 2).
In the subgroup analyses of the matched cohort of PSA
>
100 cases (
n
= 88 per treatment group), ADT was still
associated with circa three-fold higher hazard of prostate-
cancer death compared with curative treatment
( Table 3 ).
There was no significant difference in prostate-cancer
mortality between the PSA 50–100 and PSA
>
100 cohorts
(test for interaction,
p
= 0.6). Similar findings were also seen
in subgroup analyses for M0 cases (
n
= 456 per treatment
group; Supplementary Table 1) and M1/Mx cases
(
n
= 119 per treatment group; Supplementary Table 2),
again with no significant difference in prostate-cancer
mortality between subgroups (test for interaction,
p
= 0.7).
Regardless of treatment modality, men with PSA
>
100, a
higher tumor grade or stage, younger age, or fewer
comorbidities were more likely to die of prostate cancer
than those with the converse features (Supplementary Fig.
1). Further analyses showed that Nx cases were significantly
different from the N0/N1 group, especially with regard to M
stage (Supplementary Table 3). Restricting the analysis of the
Nx subcohort to NxM0 cases demonstrated no significant
differences in baseline characteristics between radically
treated and ADT patients for the matched cohort (Supple-
mentary Table 4). On repeating analyses in this subcohort,
we demonstrated similar point estimates in favor of radical
therapy as in our main matched cohort (Supplementary
Table 5). We also performed subgroup analyses on both
unmatched and matched cohorts stratified by CCI, which
showed consistent results to the main findings (Supplemen-
tary Table 6). No significant differences were seen in
prostate-cancer mortality for different CCI scores (tests for
interaction: unmatched cohort,
p
= 0.1; matched cohort,
p
= 0.6). Finally, the landmark analysis where start of follow-
up was shifted to 6 mo after diagnosis produced only
marginally different point estimates compared with the
main analyses (Supplementary Table 7).
4.
Discussion
Our study indicates that initial radical therapy might
improve survival in men at high risk of disseminated
prostate cancer. At follow-up to 15 yr, we found
>
25%
Table 2 – Mortality figures and crude and multivariable model–adjusted subdistribution hazard ratios for androgen deprivation versus
radical therapy for prostate-cancer and other-cause mortality for the study cohorts
No. of deaths
Crude sHR
(95% CI)
p
value Multivariable model–
adjusted sHR (95% CI)
p
value
ADT
Radical treatment
ADT vs radical treatment
ADT vs radical treatment
Unmatched cohort
Prostate-cancer mortality 9062/17 602 (51%)
86/750 (11%)
5.45 (4.46–6.67)
<
0.001
2.70 (2.20–3.31)
<
0.001
Other-cause mortality
4388/17 602 (25%)
68/750 (9.1%)
2.69 (2.13–3.39)
<
0.001
1.40 (1.10–1.78)
0.006
Matched cohort
Prostate-cancer mortality 177/575 (31%)
71/575 (12%)
3.00 (2.28–3.93)
<
0.001
3.49 (2.56–4.77)
<
0.001
Other-cause mortality
61/575 (11%)
58/575 (10%)
1.06 (0.74–1.51)
0.8
0.93 (0.62–1.39)
0.7
ADT = androgen deprivation therapy; CI = confidence interval; sHR = subdistribution hazard ratio.
Top rows—unmatched cohort of radically treated and androgen deprivation patients with PSA
>
50 (
n
= 18 352); bottom rows—cohort of radically treated and
androgen deprivation patients with PSA
>
50 frequency matched by PSA, clinical stage, M stage, tumor grade, Charlson comorbidity index, age, and year of
diagnosis (
n
= 1150).
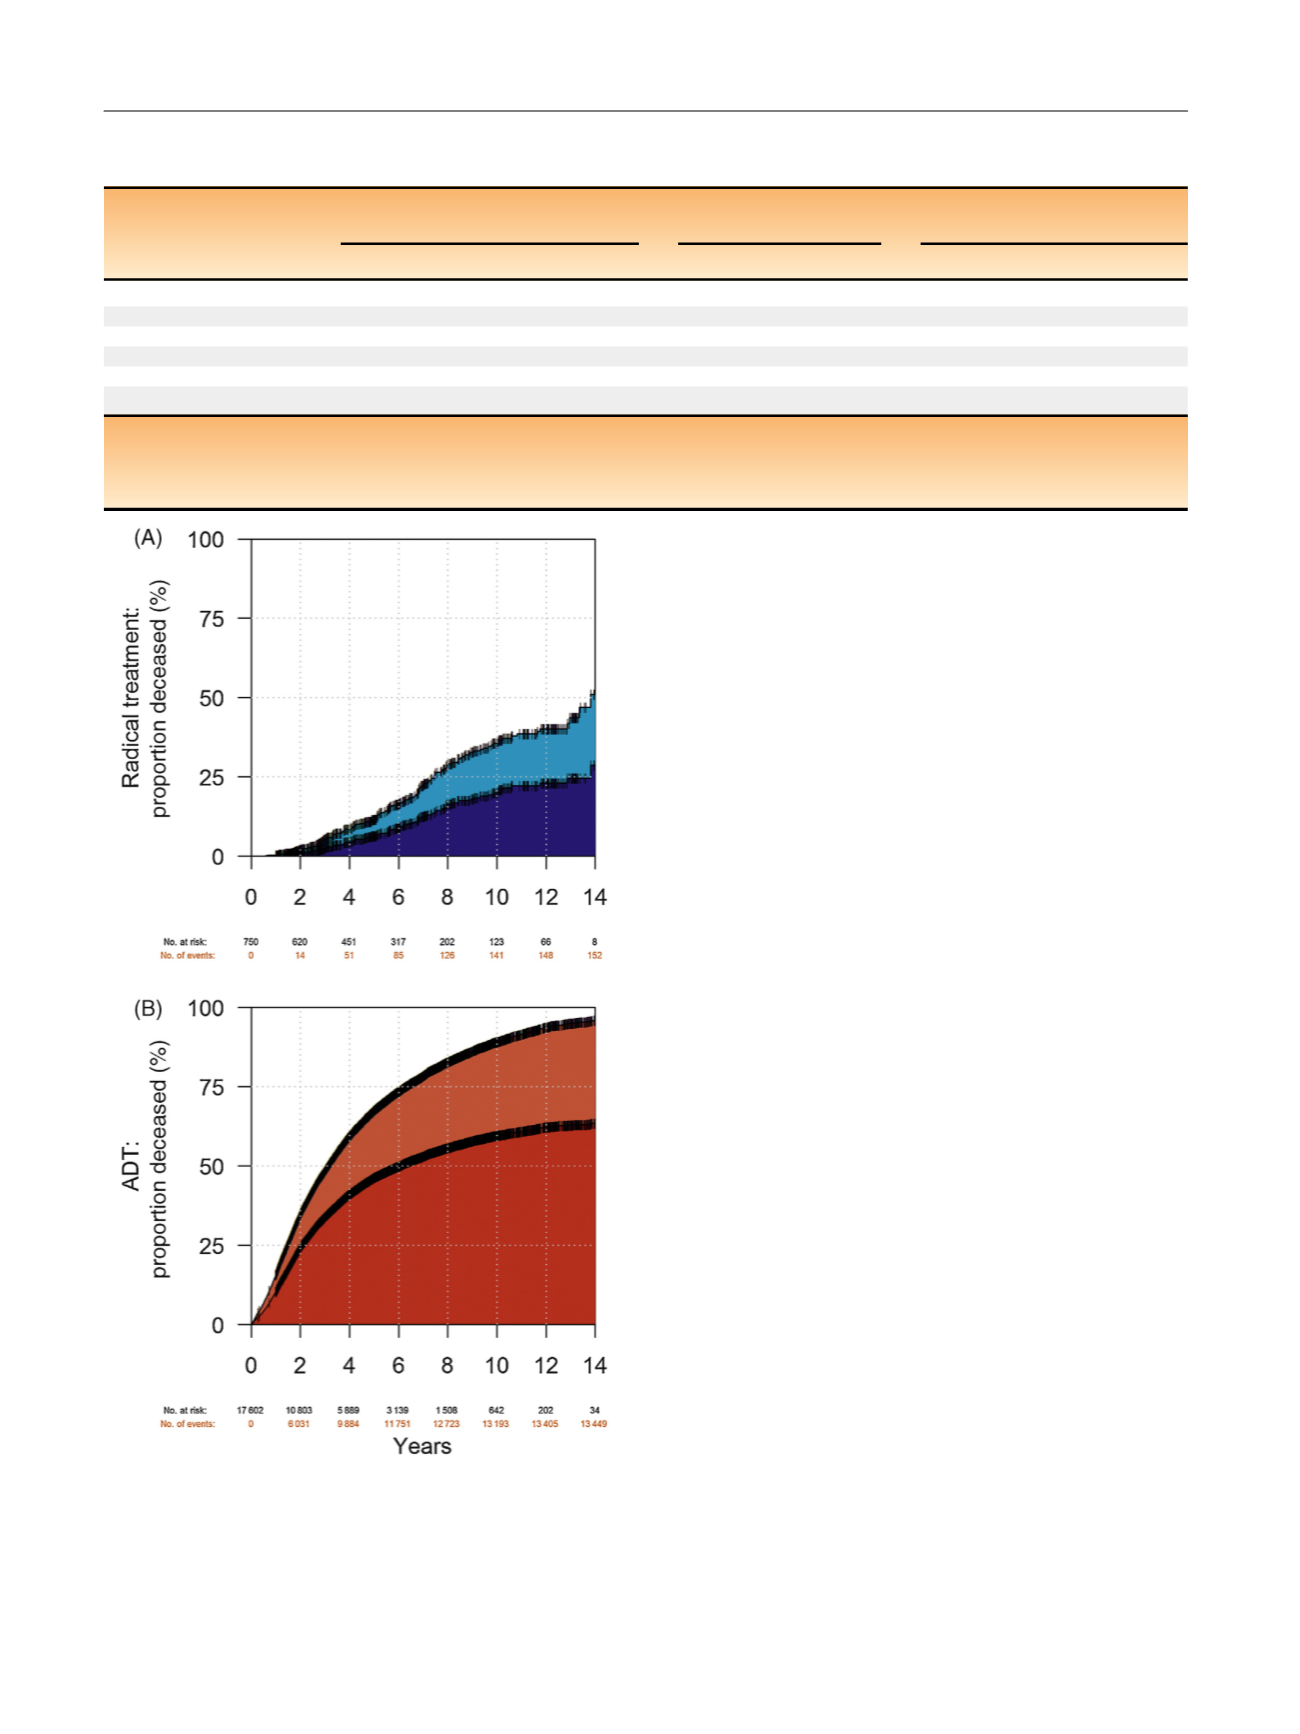
[(Fig._1)TD$FIG]
Fig. 1 – Cumulative incidence curves of prostate-cancer and other-cause
mortality for the cohort of (A) radically treated and (B) androgen
deprivation patients with PSA > 50 (
n
= 18 352). White = alive; light
blue = other-cause mortality in the radical therapy group; dark
blue = prostate-cancer mortality in the radical therapy group; light
red = other-cause mortality in the androgen deprivation group; and
dark red = prostate-cancer mortality in the androgen deprivation group.
ADT = androgen deprivation therapy; PSA = prostate-specific antigen.
E U R O P E A N U R O L O G Y 7 2 ( 2 0 1 7 ) 3 4 5 – 3 5 1
348